In the previous episode, we explored Xcode's built-in view debugger and you learned how the view debugger can help debug problems related to the user interface. Remember from the previous episode that I introduced several user interface issues in Cloudy. Let's find out how we can leverage the view debugger to discover and resolve these issues.
Missing Views
Even the best developers make mistakes from time to time and it isn't uncommon to discover that what you're seeing isn't what you expected. A common problem is not seeing one or more views you're expecting to see. This type of problem is difficult and frustrating to debug without the view debugger.
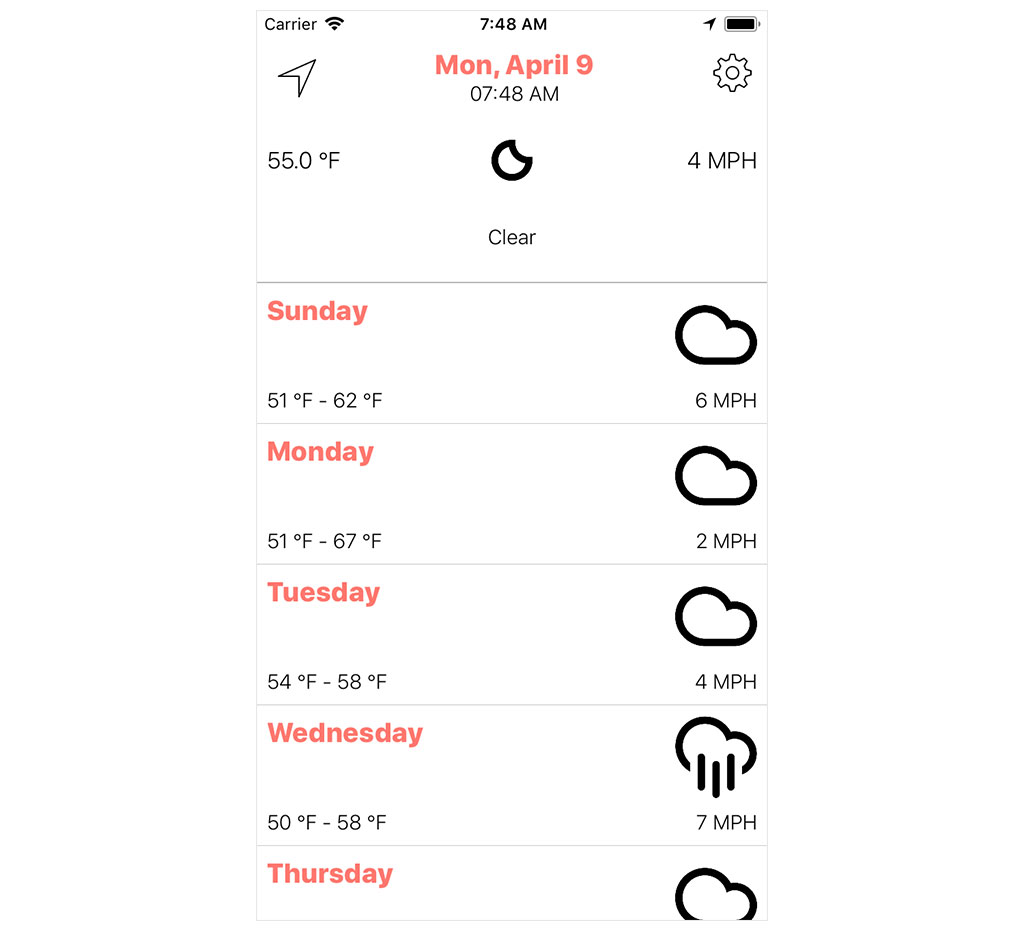
Cloudy also suffers from this problem. It should display the day and month below the day of the week. The only trace seems to be a blank space below the day of the week.
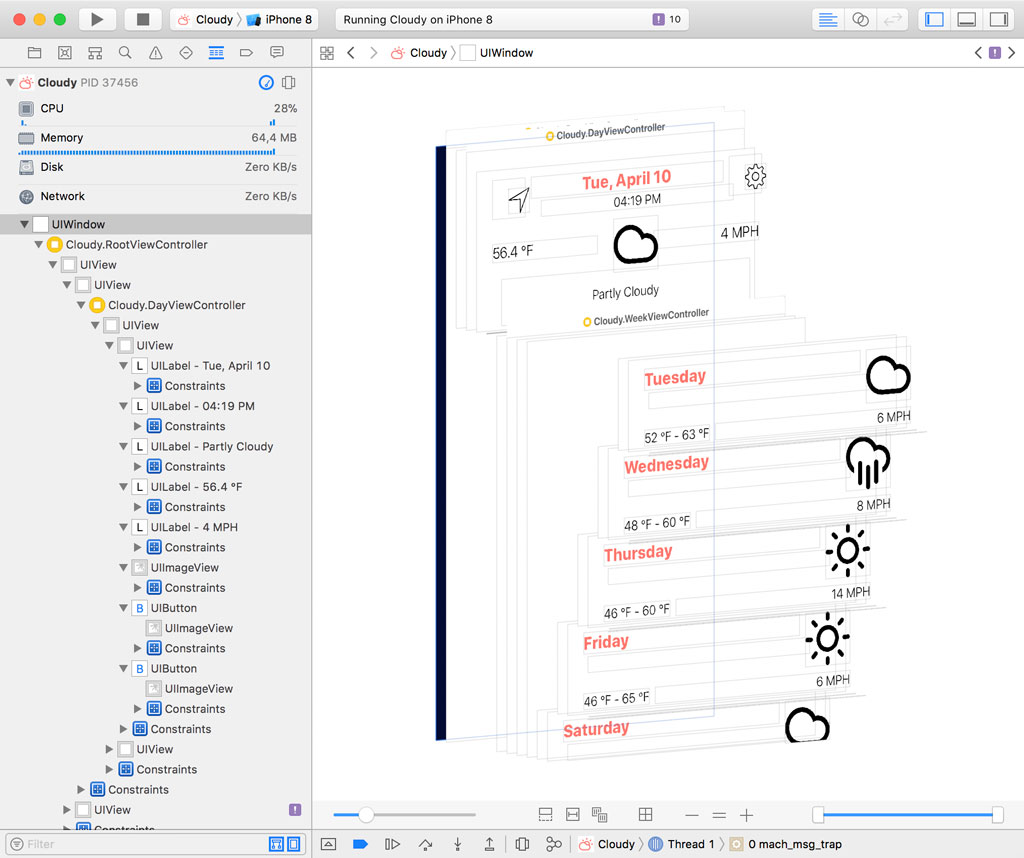
Let's inspect the application in the view debugger to find out what the problem is.
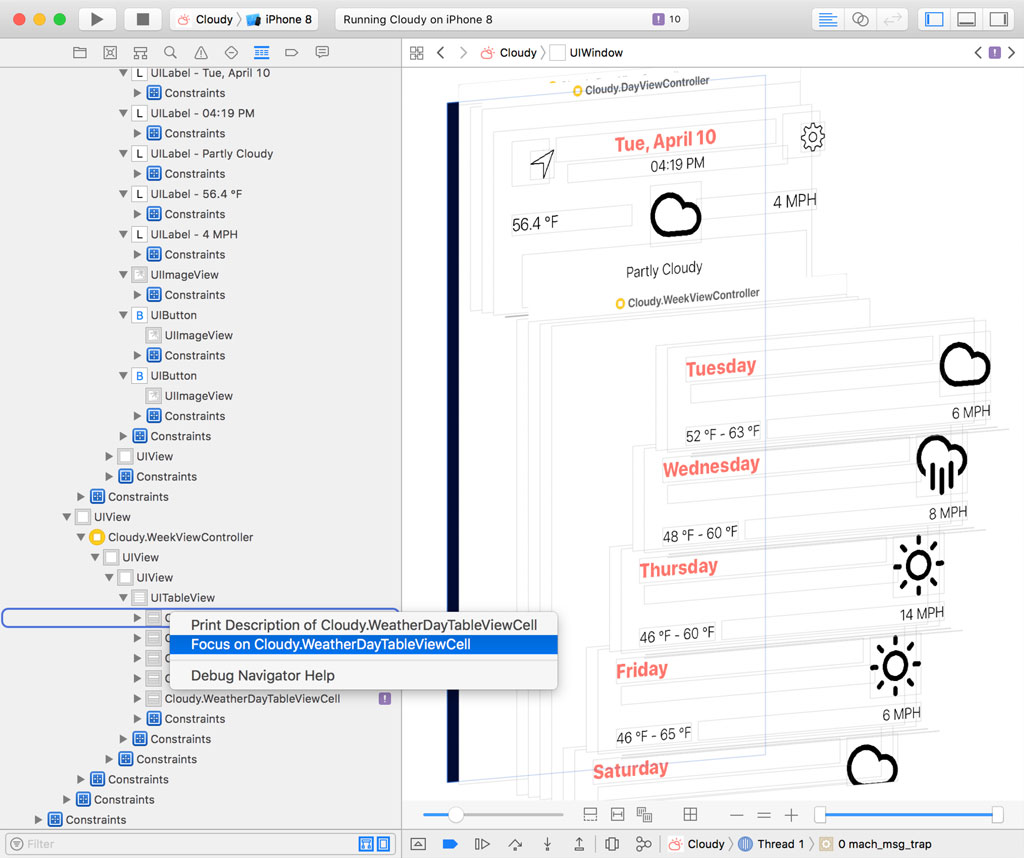
Select one of the table view cells in the Debug Navigator on the left and choose Focus on Cloudy.WeatherDayTableViewCell from the contextual menu.
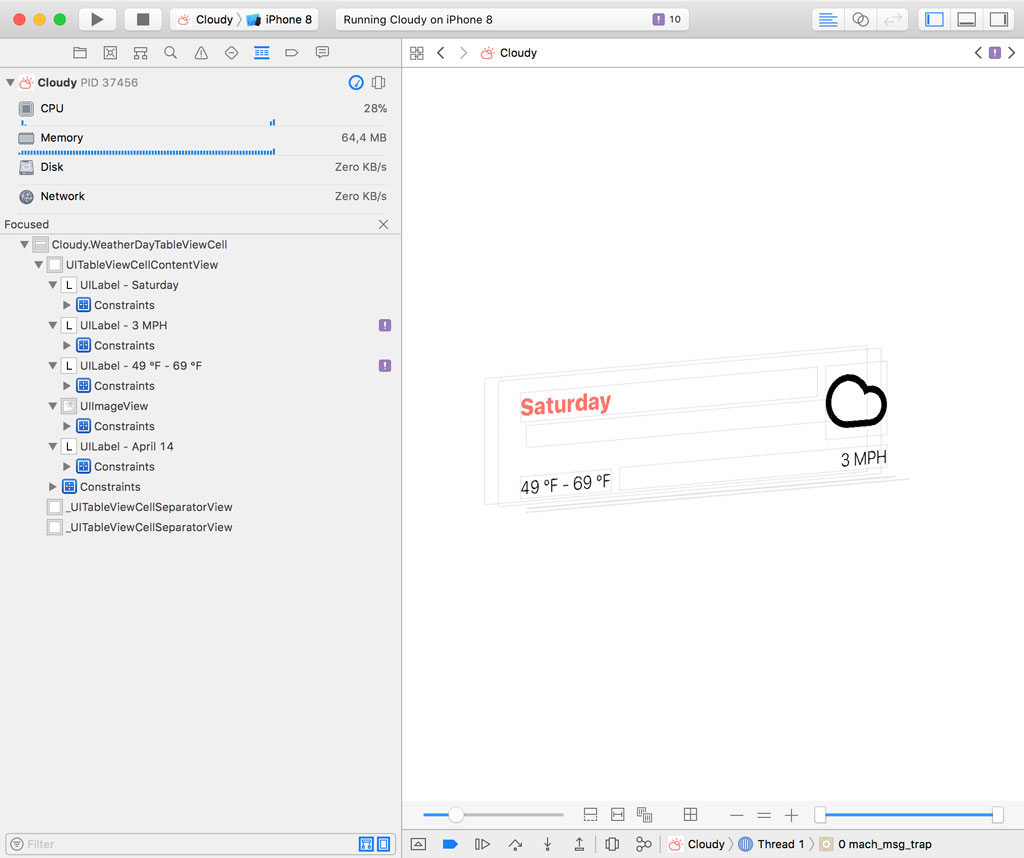
Both the view hierarchy in the Debug Navigator and the main window show us that a label with text is positioned below the top label. Select the label and open the Object Inspector on the right.
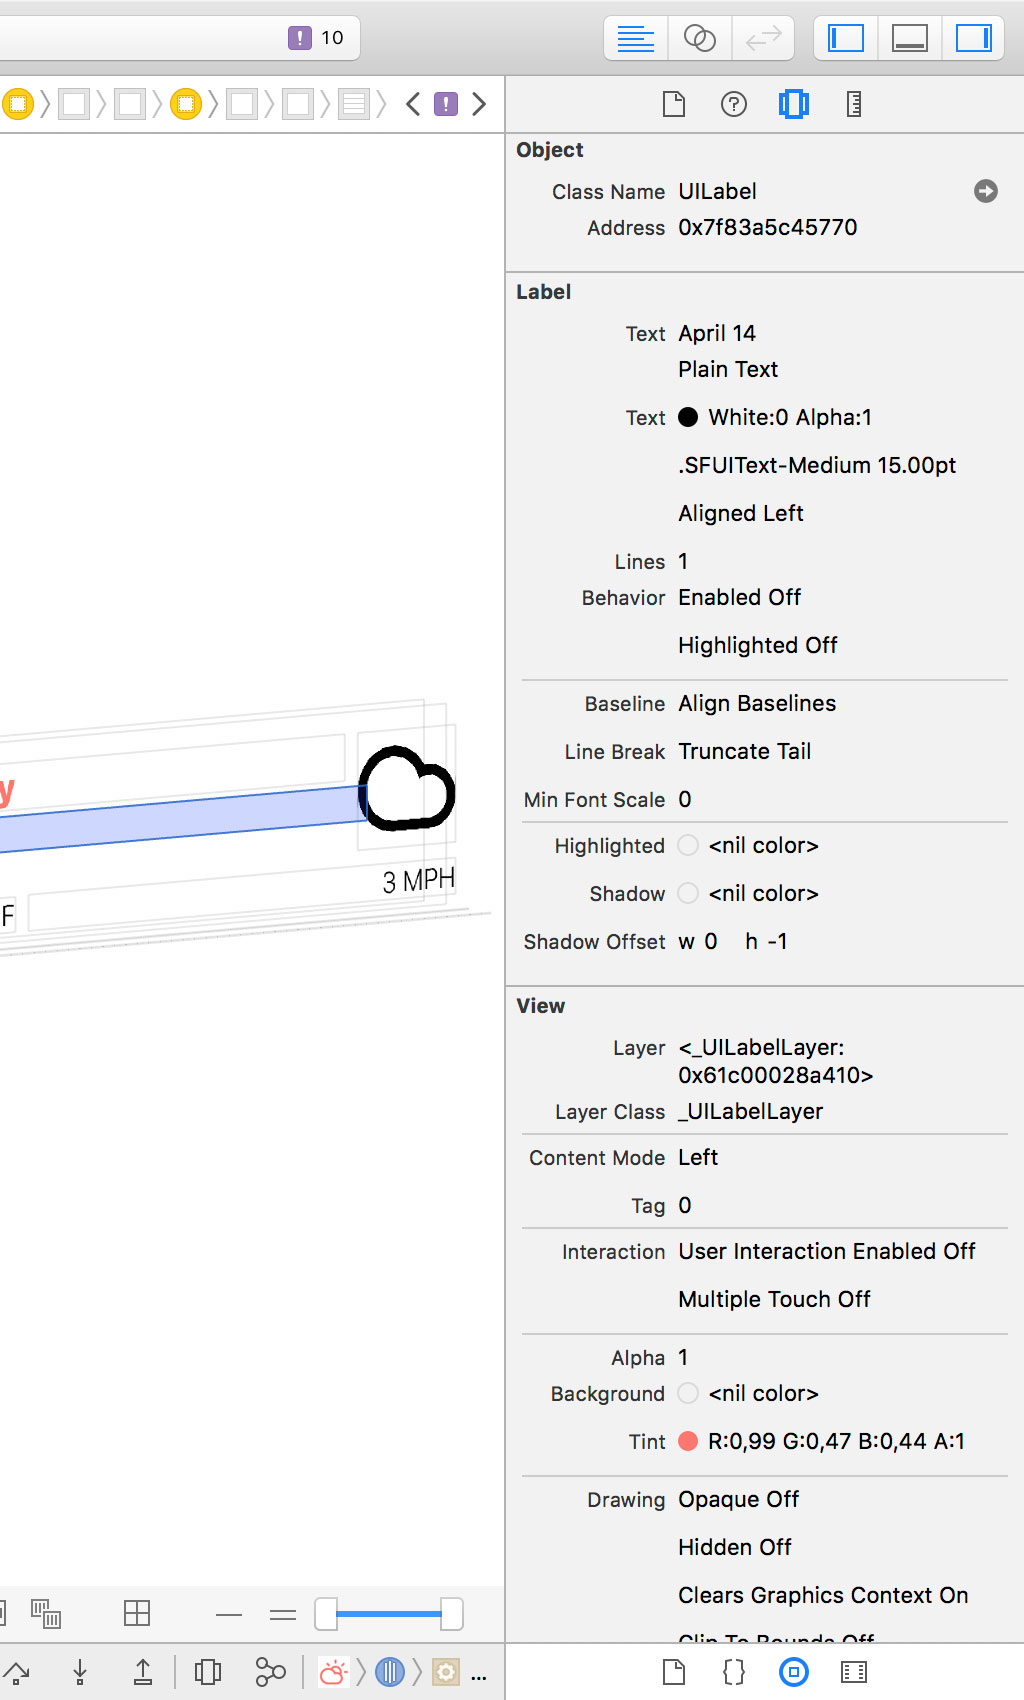
The Object Inspector shows us that the label isn't hidden. The text of the label is set and the text color is set to black. That can't be the reason we're not seeing the day and month of the forecast.
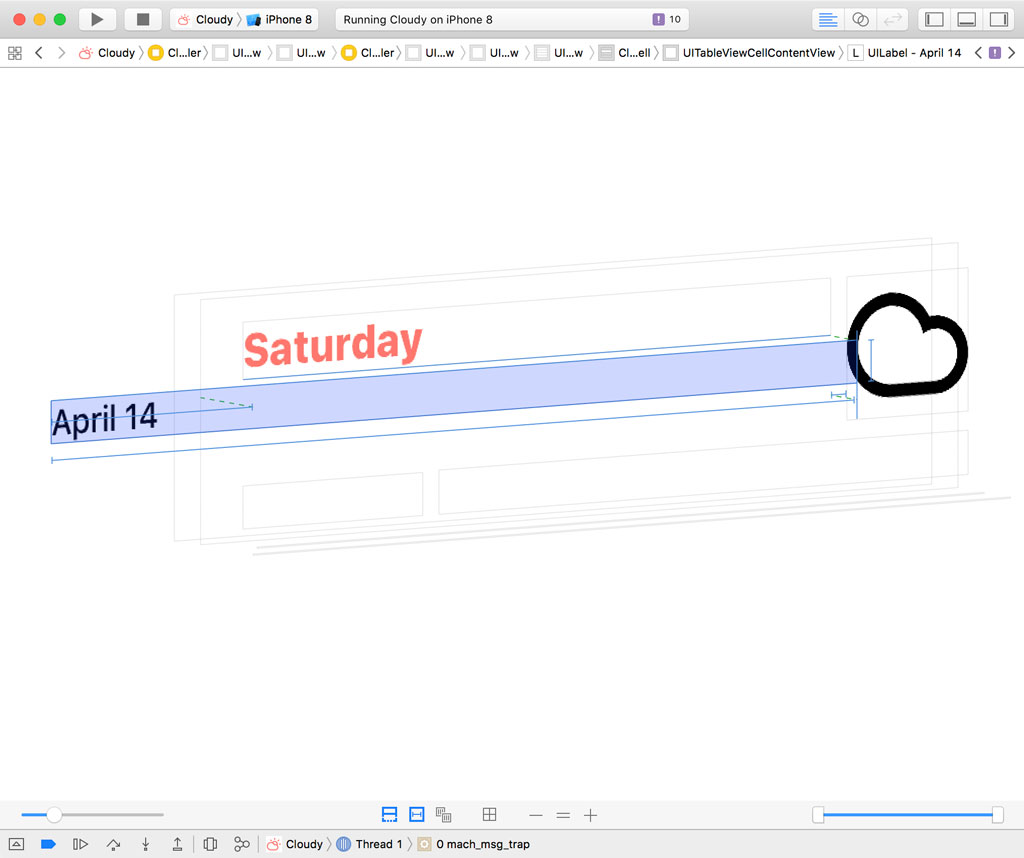
Let's click the Show Clipped Content button to make sure the text of the label isn't clipped.
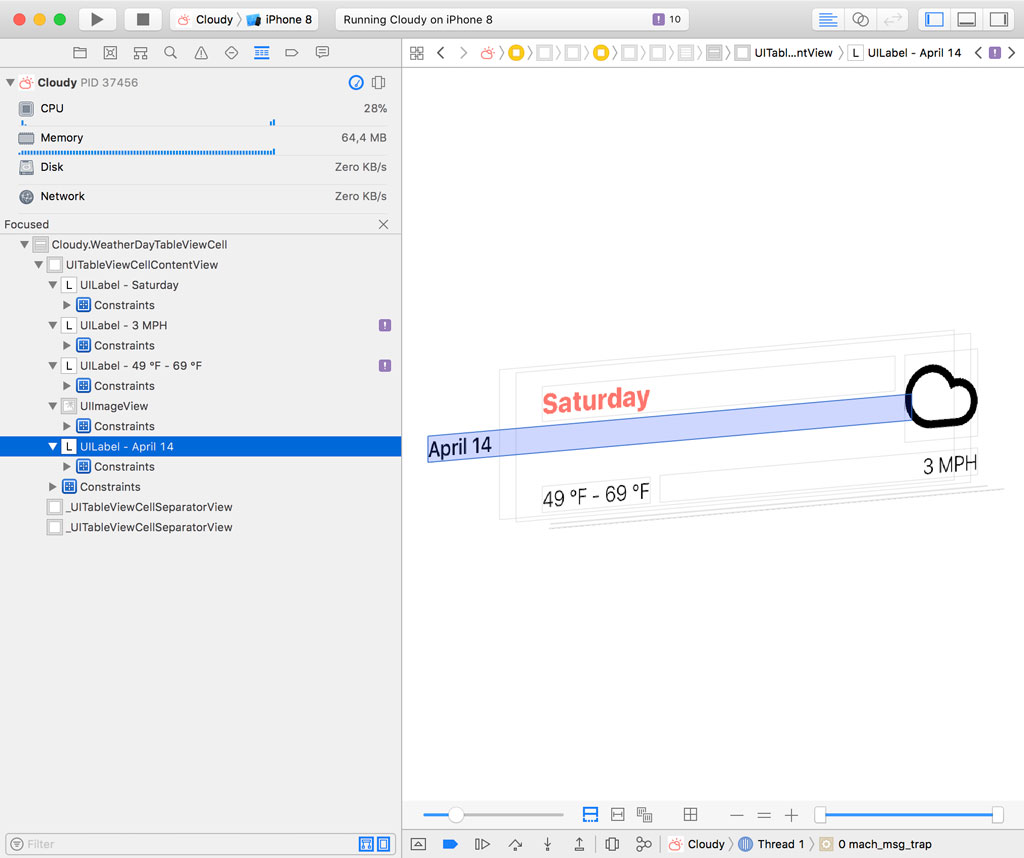
It looks like we found the problem. If we switch to the two-dimensional mode of the view debugger, the problem is clear. The text of the label isn't visible because the label is incorrectly positioned.
The frame of the label in the Size Inspector confirms this. The x-coordinate of the label is equal to -100. The list of constraints in the Size Inspector exposes the root cause of the problem. The constant of the leading constraint is set to -100.
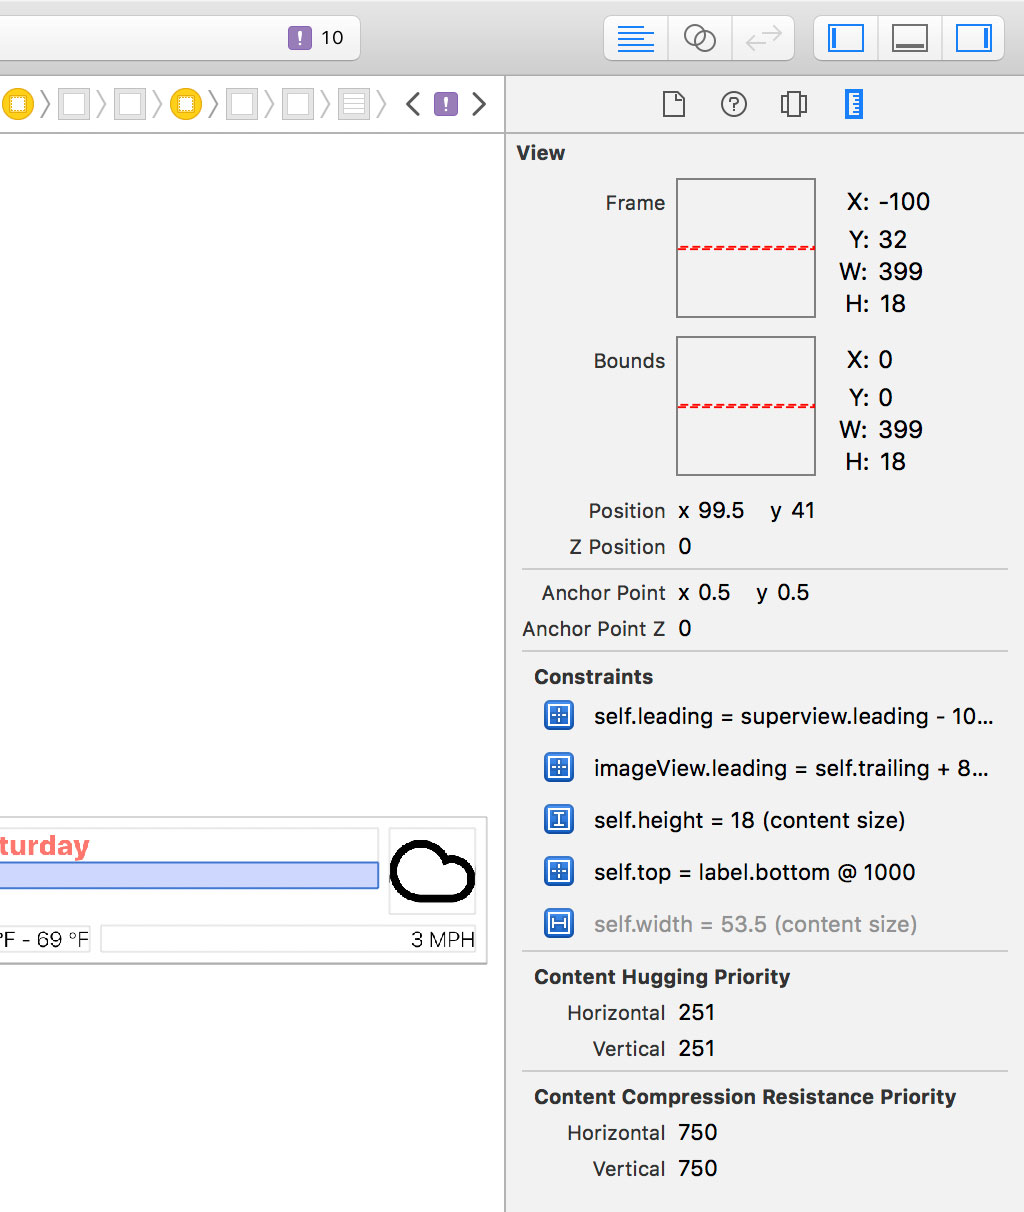
Click the Show Constraints button to show the constraints of the label.
The solution is straightforward. Stop the application and open Main.storyboard. Locate the Week View Controller Scene and select the Date Label in the content view of the weather day table view cell.
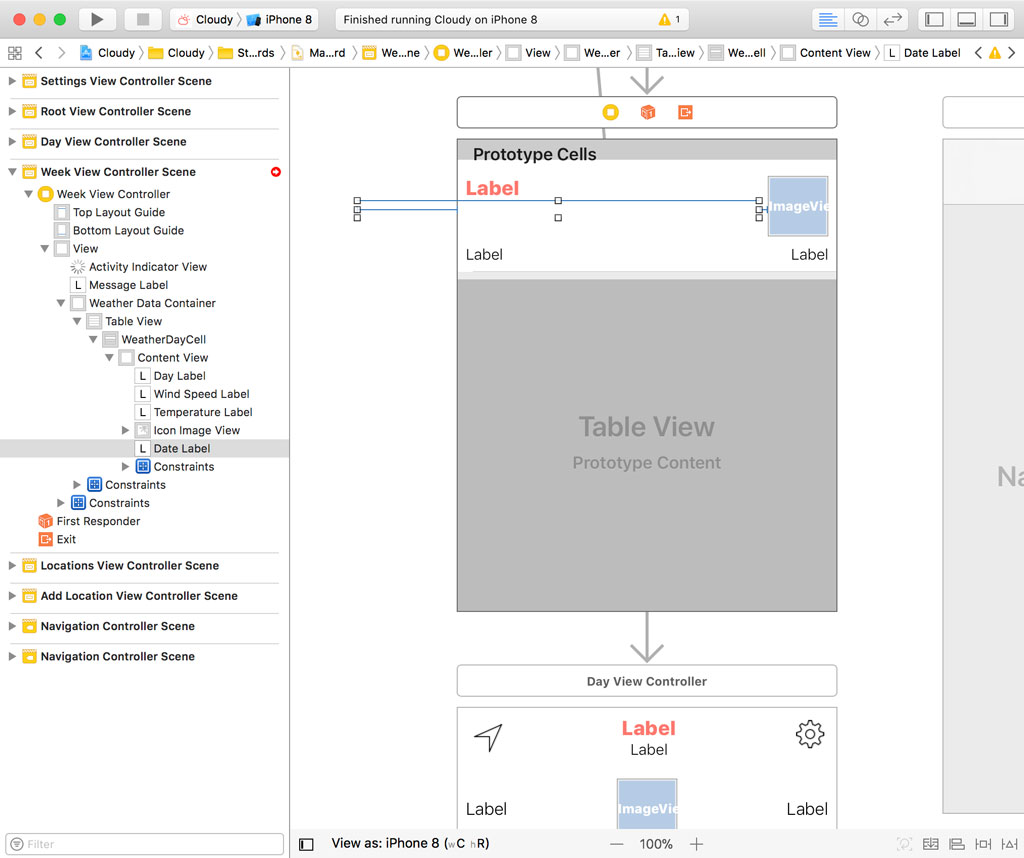
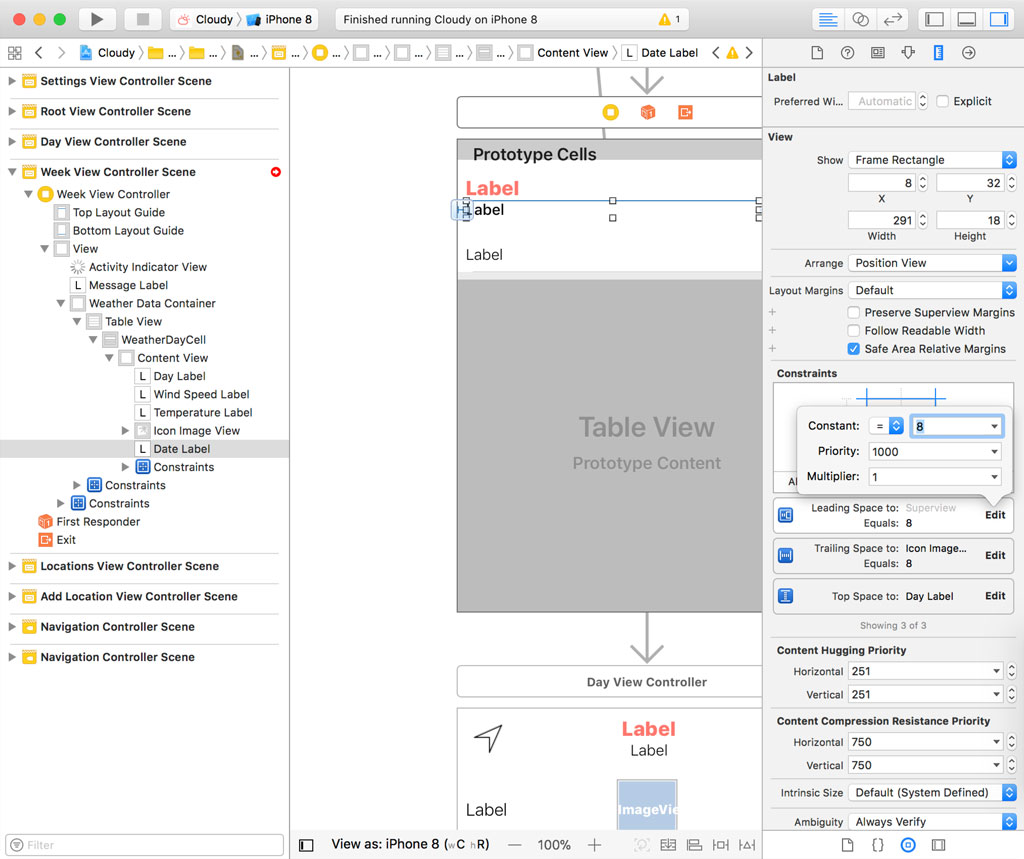
Open the Size Inspector on the right to show the constraints of the label. Double-click the constraint that defines the leading space of the label and set its constant to 8.
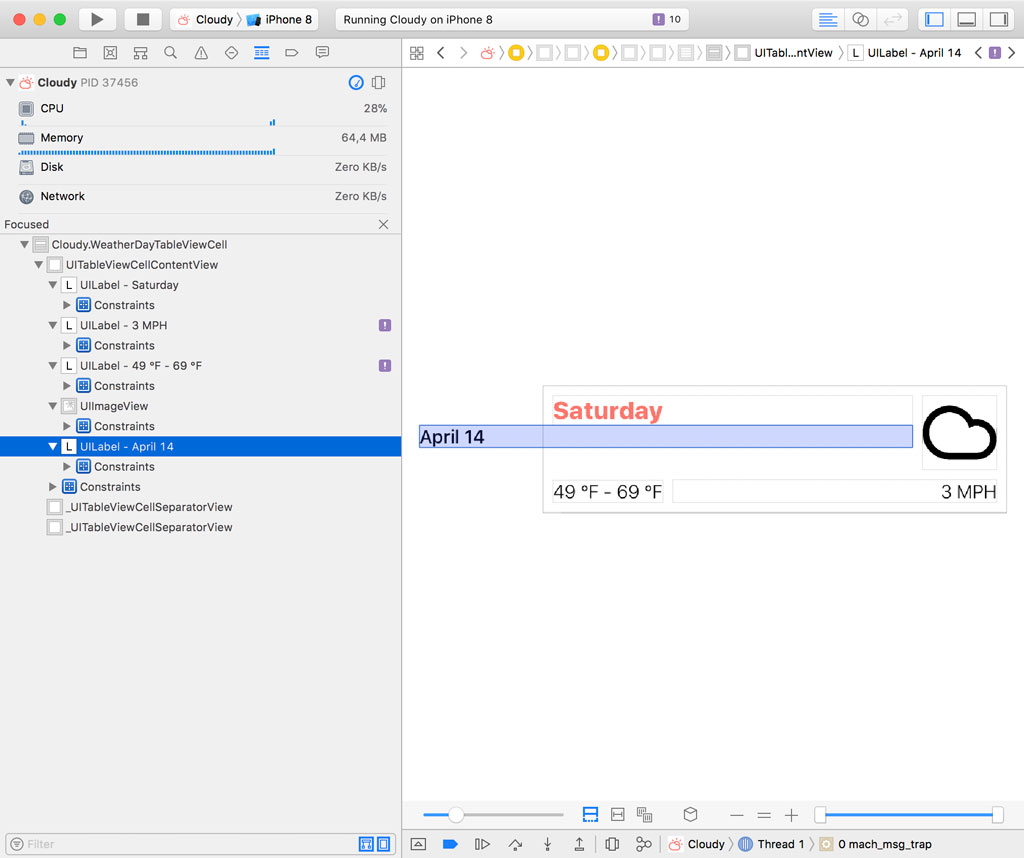
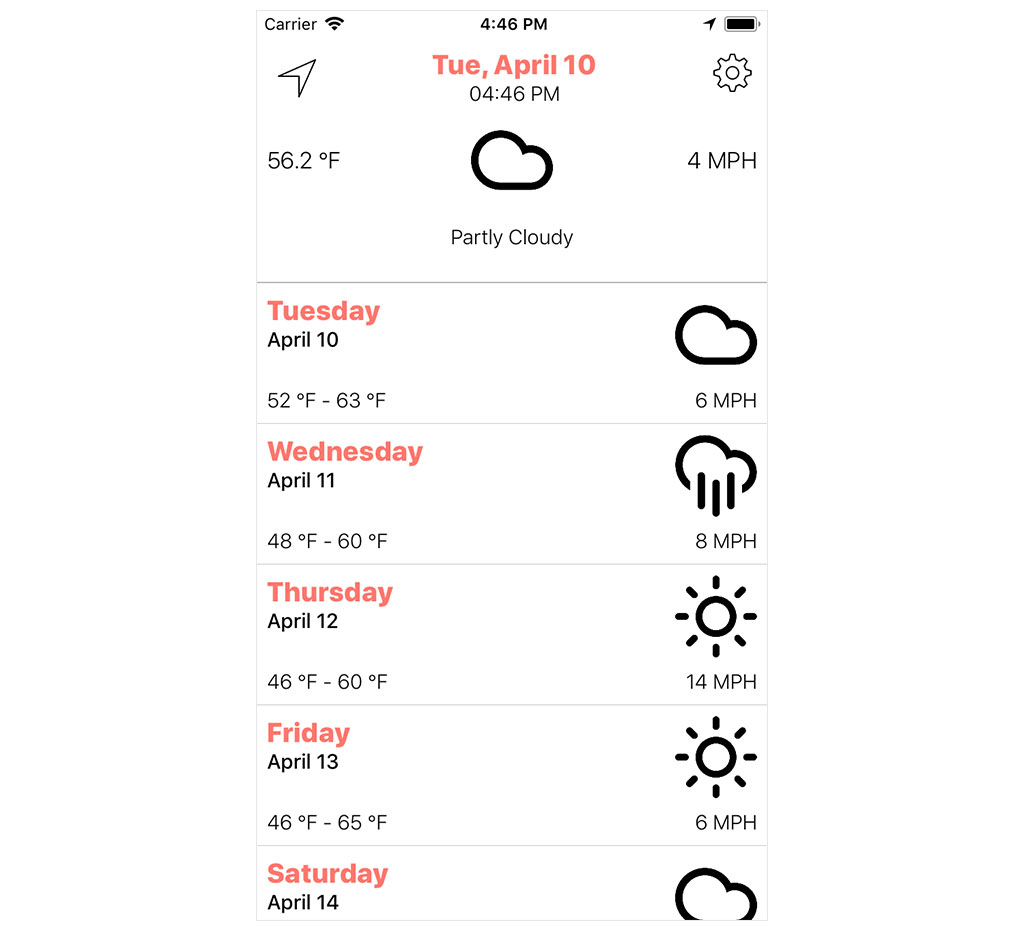
Run the application to make sure we fixed the issue. That looks better.
Auto Layout Conflicts
Auto Layout is great when it works, but it can be tedious and frustrating to debug Auto Layout issues. The view debugger can help us with this, though. Let me show you how.
Run the application and click the Debug View Hierarchy button in the debug bar. Open the Issue Navigator on the left.
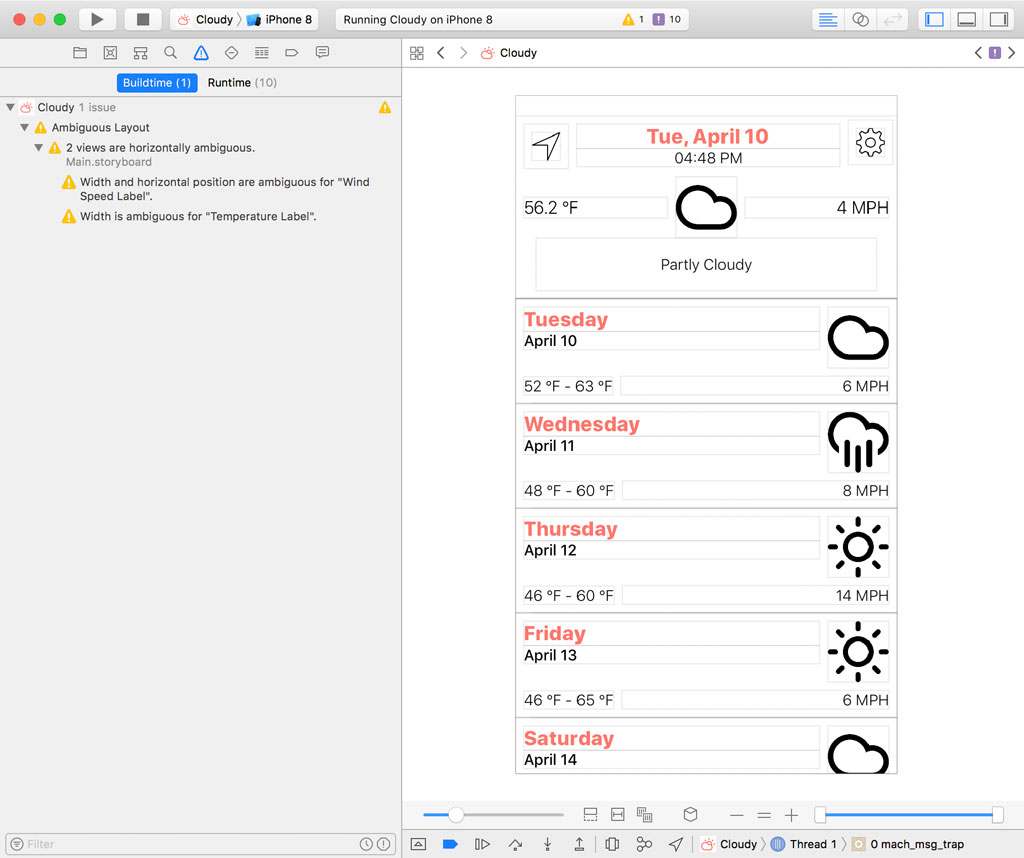
The Issue Navigator shows us issues at build time, but it also shows us issues the debugger detects at runtime. The Issue Navigator lists ten layout issues.
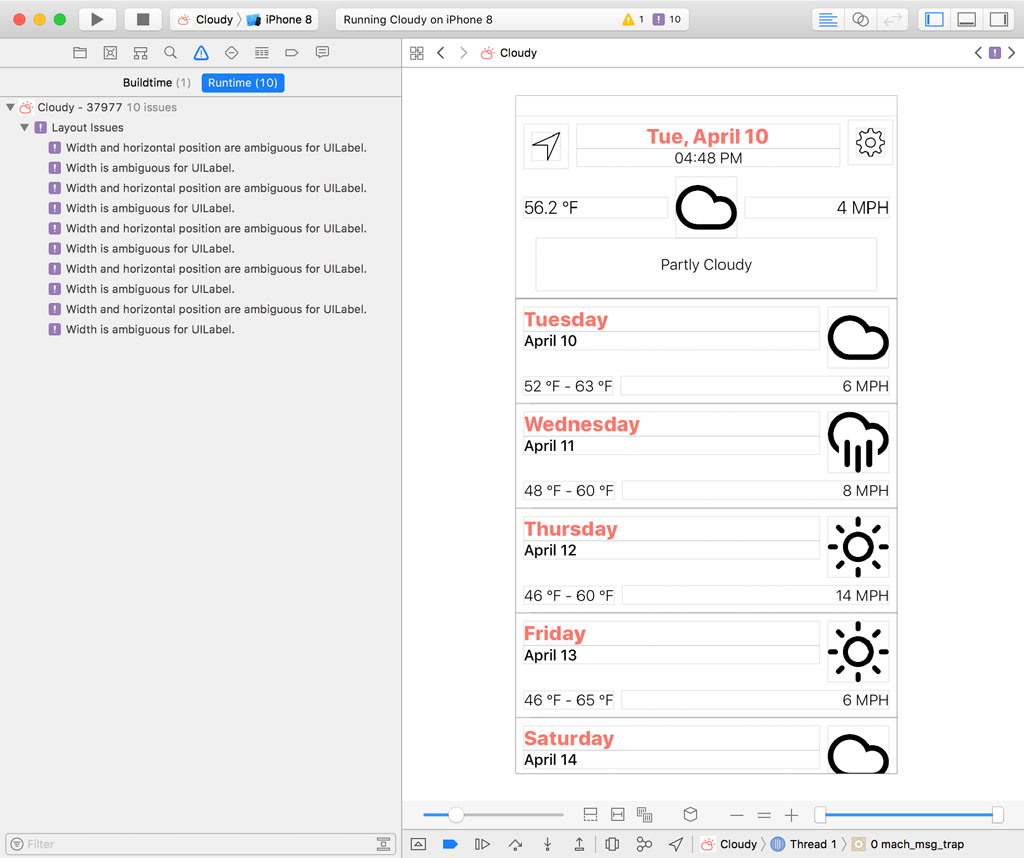
If we select one of the issues in the Issue Navigator, Xcode highlights the corresponding view in the main window and the Size Inspector on the right.
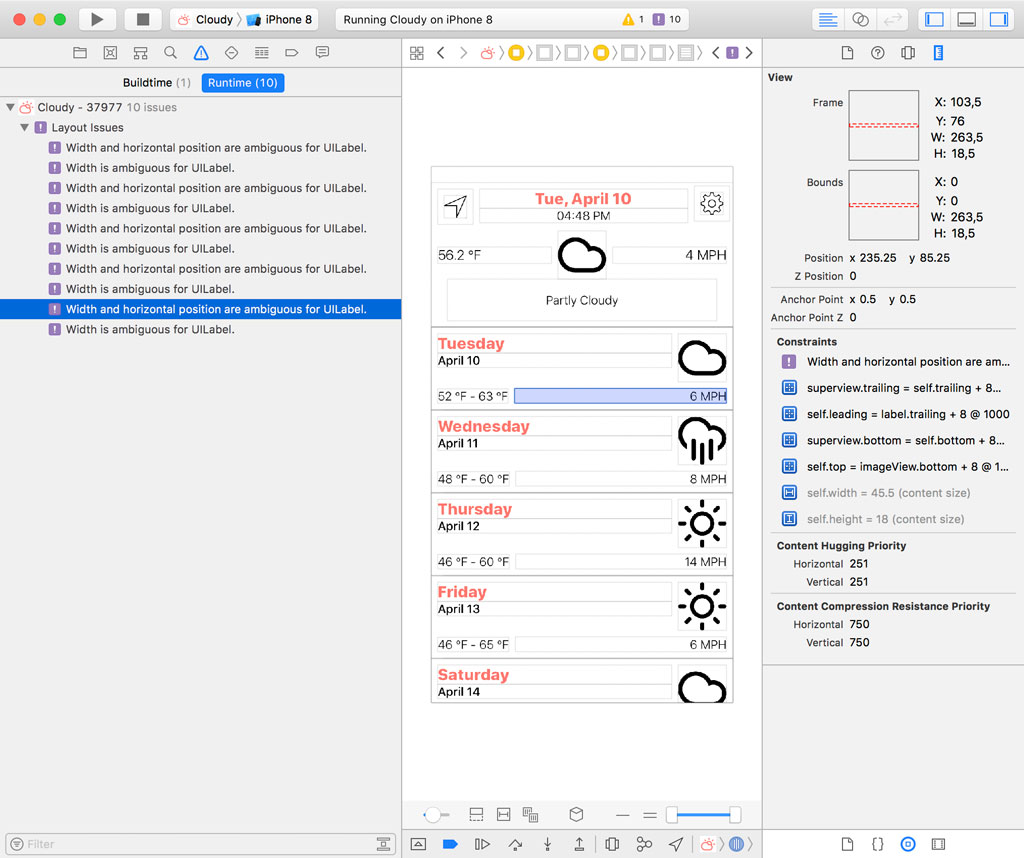
Xcode reports that the width and horizontal position of a UILabel instance is ambiguous. To understand the issue, we need to take a look at the output in Xcode's console.
[LayoutConstraints] View has an ambiguous layout. See "Auto Layout Guide: Ambiguous Layouts" for help debugging. Displaying synopsis from invoking -[UIView _autolayoutTrace] to provide additional detail.

*UILabel:0x7ff11df45140'9 MPH'- AMBIGUOUS LAYOUT for UILabel:0x7ff11df45140'9 MPH'.minX{id: 674}, UILabel:0x7ff11df45140'9 MPH'.Width{id: 675}

Legend:
    * - is laid out with auto layout
    + - is laid out manually, but is represented in the layout engine because translatesAutoresizingMaskIntoConstraints = YES
    • - layout engine host
Despite Xcode's help, it isn't clear what the issue is. Let's take a look at the user interface in Main.storyboard. If we take a closer look at the Week View Controller Scene, we see that Interface Builder reports an error.
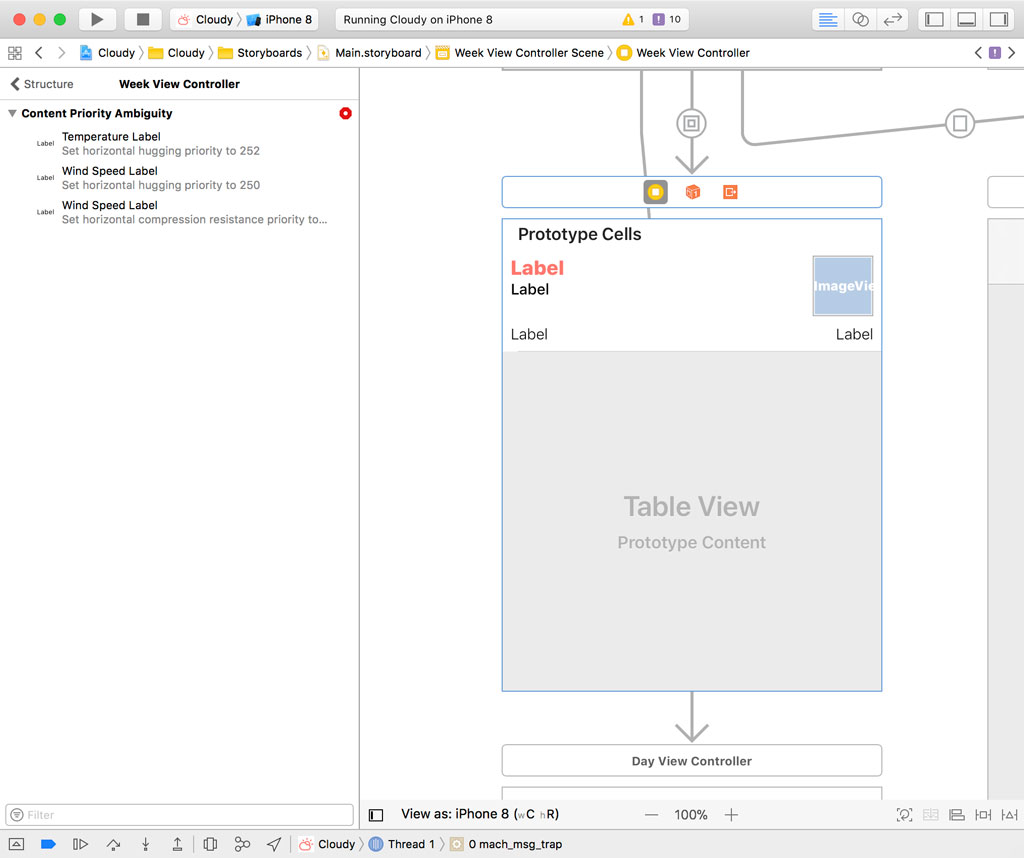
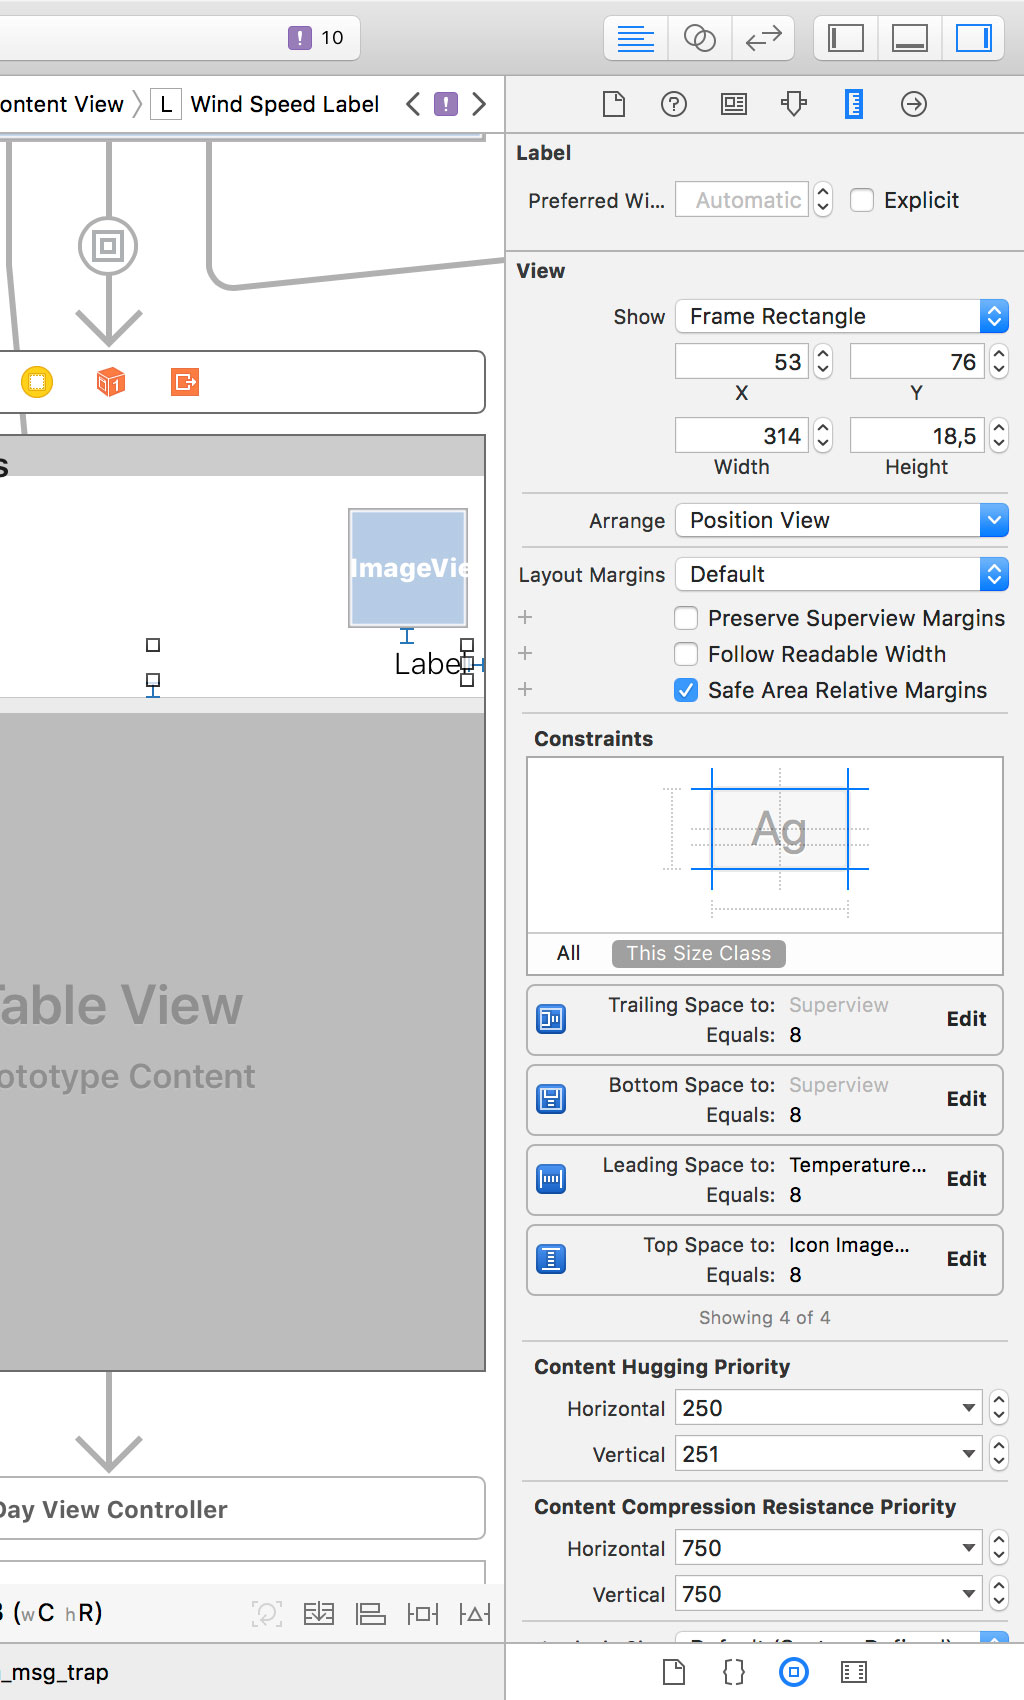
The error makes more sense. Interface Builder warns us that there's a content priority issue. The temperature label's leading edge is fixed to the leading edge of its superview and the wind speed label's trailing edge is fixed to the trailing edge of its superview. I also added a constraint to prevent the labels from overlapping one another if they contain a lot of text. The temperature label's trailing edge is fixed to the wind speed label's leading edge. That's a common strategy to avoid text overlap.
It also means that one of the labels needs to be stretched to satisfy the layout. Both labels have the same horizontal content hugging priority, which means the layout engine doesn't know which label it needs to stretch to satisfy the layout. In other words, the layout is ambiguous. A layout should always have a single solution and that isn't true in this scenario.
The solution is simple, though, and Interface Builder gives us a hint to resolve the issue. We need to make sure the horizontal content hugging priority of one of the labels is lower than that of the other label. Select the label on the right and set its horizontal content hugging priority to 250. The result is that the right label is more willing to stretch if necessary.
The errors disappear and the same is true for the runtime issues we saw earlier.
We could have prevented this by making sure the application was built without issues. That's a best practice I always try to stick with, but it can sometimes be difficult to convince other team members of the value of this habit.
The issue we fixed was fairly straightforward, but that isn't always true. Auto Layout can be very difficult to debug if you're working with complex user interfaces or third party libraries.
I feel Xcode's view debugger could be more helpful when debugging Auto Layout issues. Let me show you what I mean. Open WeatherDayTableViewCell.swift and navigate to the awakeFromNib() method.
override func awakeFromNib() {
    super.awakeFromNib()

    // Configure Cell
    selectionStyle = .none
}
In awakeFromNib(), we fix the width of iconImageView to 100 points.
override func awakeFromNib() {
    super.awakeFromNib()

    // Configure Cell
    selectionStyle = .none

    // Fix Width to 100 Points
    iconImageView.widthAnchor.constraint(equalToConstant: 100.0).isActive = true
}
If we run the application, we can see that the layout engine doesn't like this change. We set the width of the image view to 60 points in Interface Builder, which conflicts with the constraint we added in code. The output in Xcode's console confirms this.
[LayoutConstraints] Unable to simultaneously satisfy constraints.
    Probably at least one of the constraints in the following list is one you don't want.
    Try this:
        (1) look at each constraint and try to figure out which you don't expect;
        (2) find the code that added the unwanted constraint or constraints and fix it.
(
    "<NSLayoutConstraint:0x614000281310 UIImageView:0x7fd30e717e80.width == 60   (active)>",
    "<NSLayoutConstraint:0x6140002816d0 UIImageView:0x7fd30e717e80.width == 100   (active)>"
)

Will attempt to recover by breaking constraint
<NSLayoutConstraint:0x6140002816d0 UIImageView:0x7fd30e717e80.width == 100   (active)>

Make a symbolic breakpoint at UIViewAlertForUnsatisfiableConstraints to catch this in the debugger.
The methods in the UIConstraintBasedLayoutDebugging category on UIView listed in <UIKit/UIView.h> may also be helpful.
The problem is that the view debugger doesn't notify us of the problem. The layout engine breaks the constraint we added in code, but there's no indication in the view debugger that the layout is unsatisfiable. That's a missed opportunity, which I hope Apple addresses in a future release of Xcode.
What's Next?
The view debugger is often an effective tool to detect and inspect user interface issues, including issues related to Auto Layout. It's a welcome addition to Xcode's debugging tools.
In the next episode, we make a detour by taking a look at Reveal. Reveal is a third party application I've been using for several years. It was released before Apple added support for view debugging to Xcode. Like Xcode's built-in view debugger, Reveal allows you to inspect your application's view hierarchy and it has several features that are missing from Xcode's built-in view debugger.