The test failure and constraint error breakpoints are lesser known breakpoint types. When used correctly, however, they can be quite useful. Let's start with the test failure breakpoint.
Test Failure Breakpoint
Let's take Cloudy as an example. In Mastering MVVM With Swift, we write unit tests for the view models of the project. That gives us a test suite to work with. Run the test suite to make sure every unit test passes.
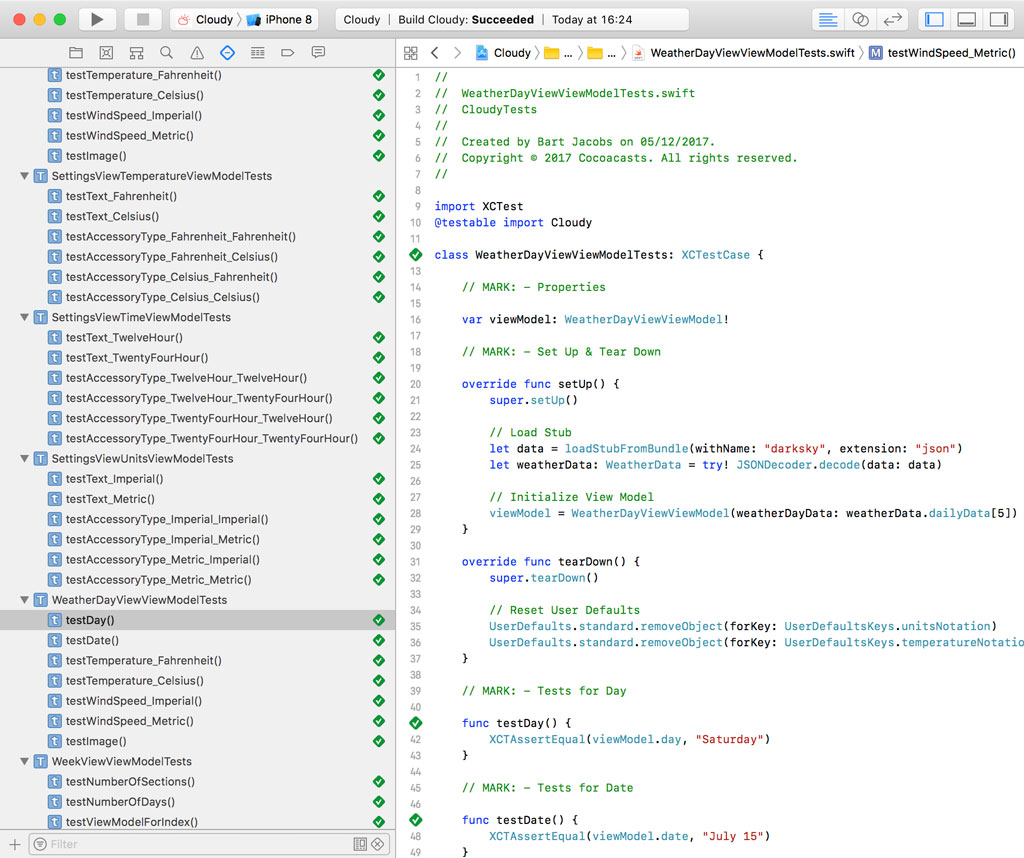
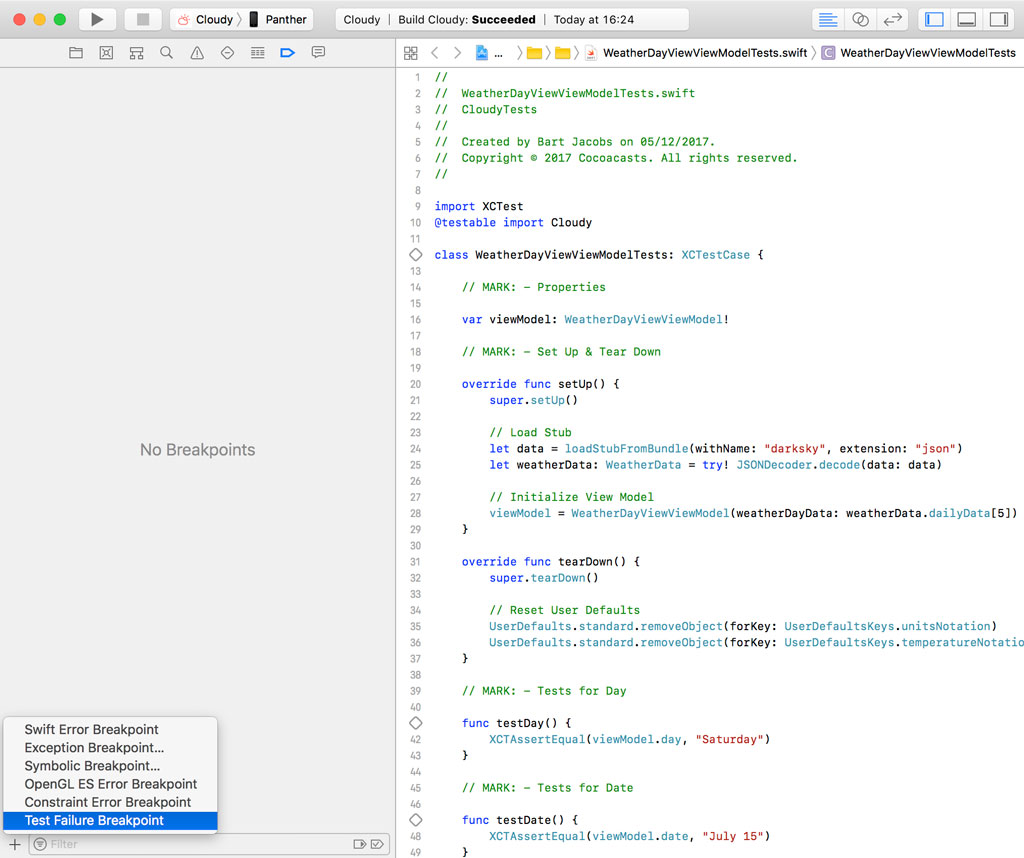
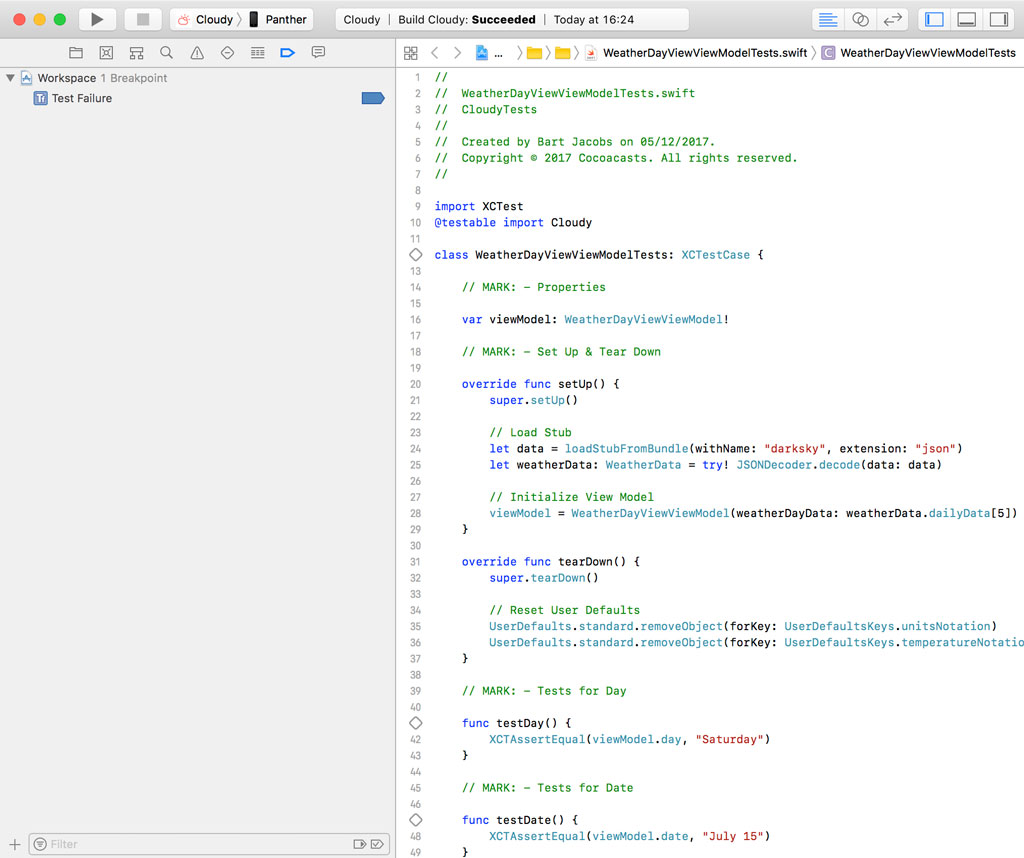
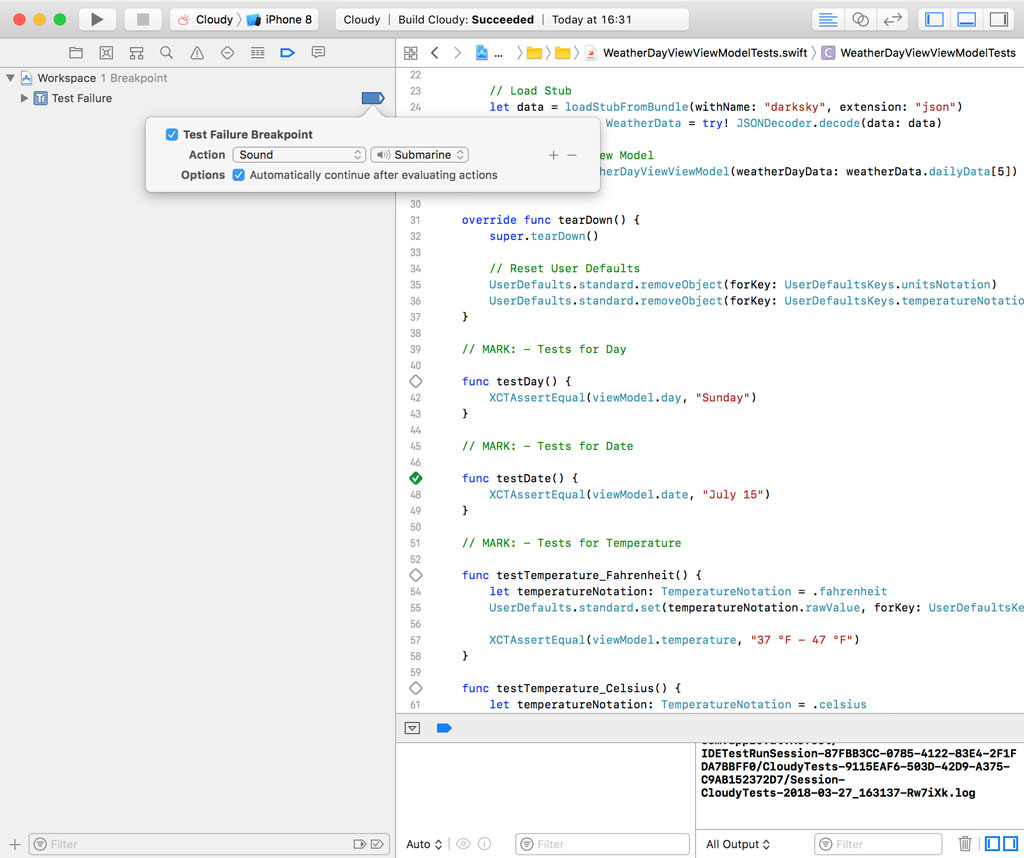
The test failure breakpoint interrupts a test run when a test reports a failed assertion. Let me show you how that works. Open the Breakpoint Navigator on the left, click the + button in the lower left, and choose Test Failure Breakpoint.
Let's sabotage the test suite to see how the test failure breakpoint can help us. Open WeatherDayViewViewModelTests.swift and locate the testDay() method. Replace Saturday with Sunday in the assertion of the unit test.
func testDay() {
    XCTAssertEqual(viewModel.day, "Sunday")
}
Run the test suite to find out what happens. The debugger pauses the test run the moment the testDay() method reports the failed assertion.

Even though Xcode automatically notifies you when a test fails, the test failure breakpoint immediately takes you to the assertion that caused the test to fail. It saves you time and makes debugging failed tests more efficient.
The strategy I usually adopt takes advantage of breakpoint actions. Open the Breakpoint Navigator and edit the test failure breakpoint.
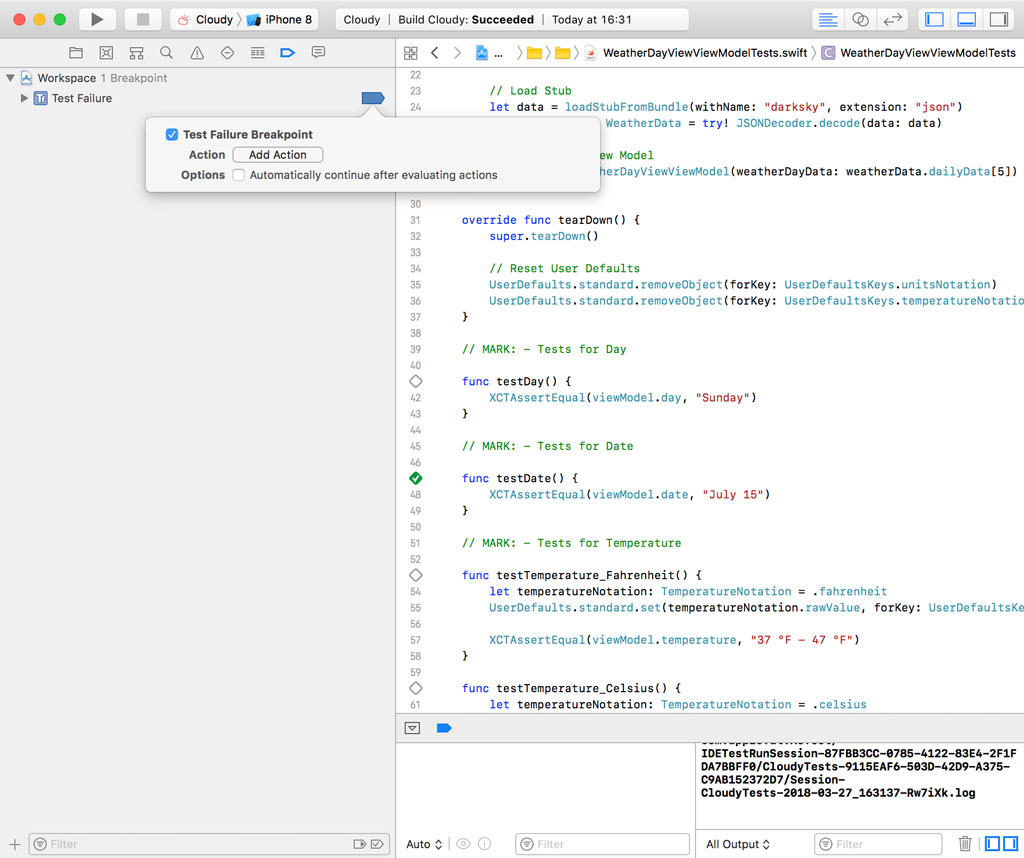
Click the Add Action button and choose Sound. Check the checkbox labeled Automatically continue after evaluating actions. This simple setup notifies me when one or more tests fail. If Xcode notifies me of a failed test, I uncheck Automatically continue after evaluating actions to take a closer look at the problem.
Playing sound is often more convenient than ploughing through logs or test results. Give it a try and see if you like it.
Constraint Error Breakpoint
The constraint error breakpoint pauses the execution of the application when the debugger runs into an Auto Layout error. This usually means that a layout is ambiguous or unsatisfiable. We discuss ambiguous and unsatisfiable layouts in more detail in Auto Layout Fundamentals.
An Example
I've created a sample project to get us started. You can find the project in the source files of this episode. Open Main.storyboard to see the user interface of the View Controller Scene. The storyboard contains a basic sign in form with two text fields and a button.
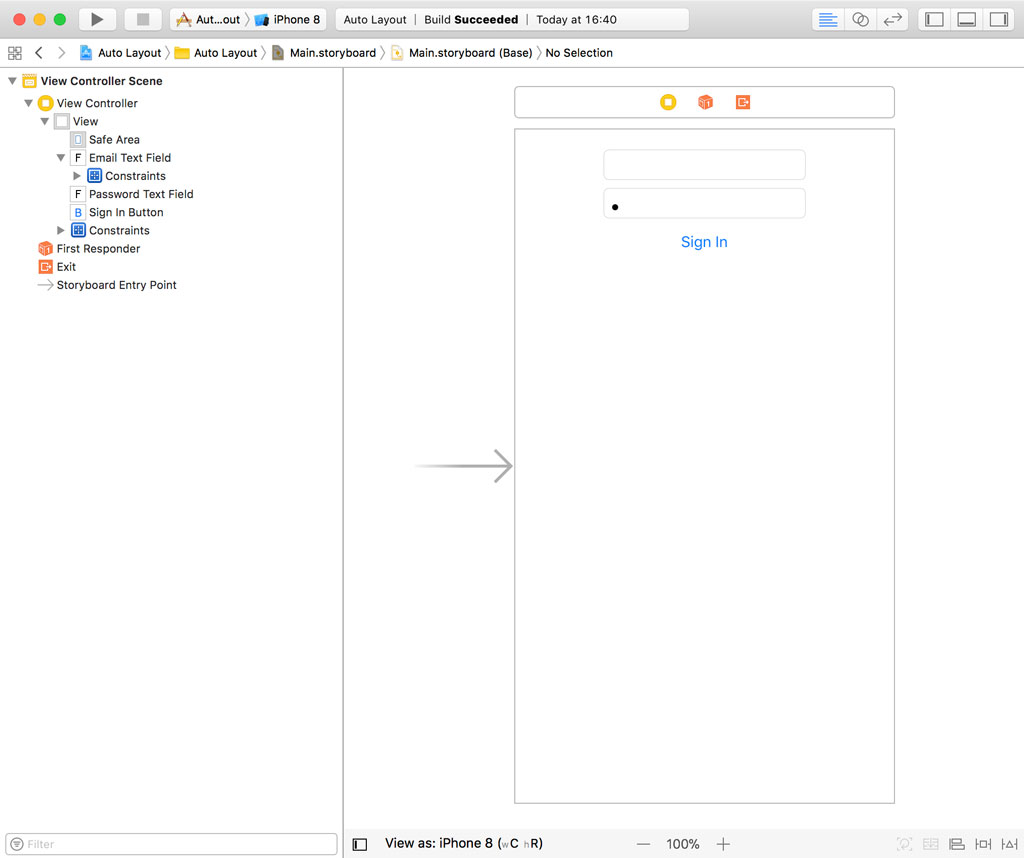
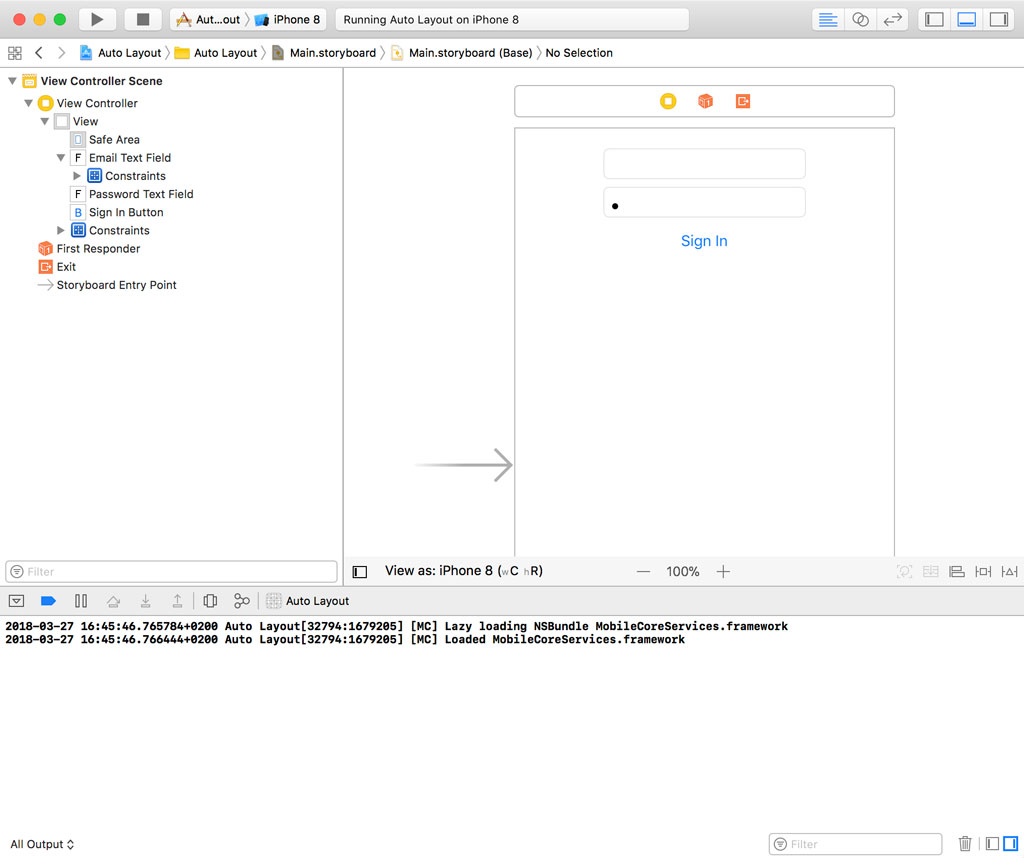
The top text field is 200.0 points wide. The width of the bottom text field and the button are equal to that of the top text field. The user interface looks fine if we run the application in the simulator. No warnings or errors show up and the console shows us that everything's fine.
Even though Interface Builder is great for working with constraints, it often happens that I need to update the user interface in code. That can lead to Auto Layout conflicts if you're not careful.
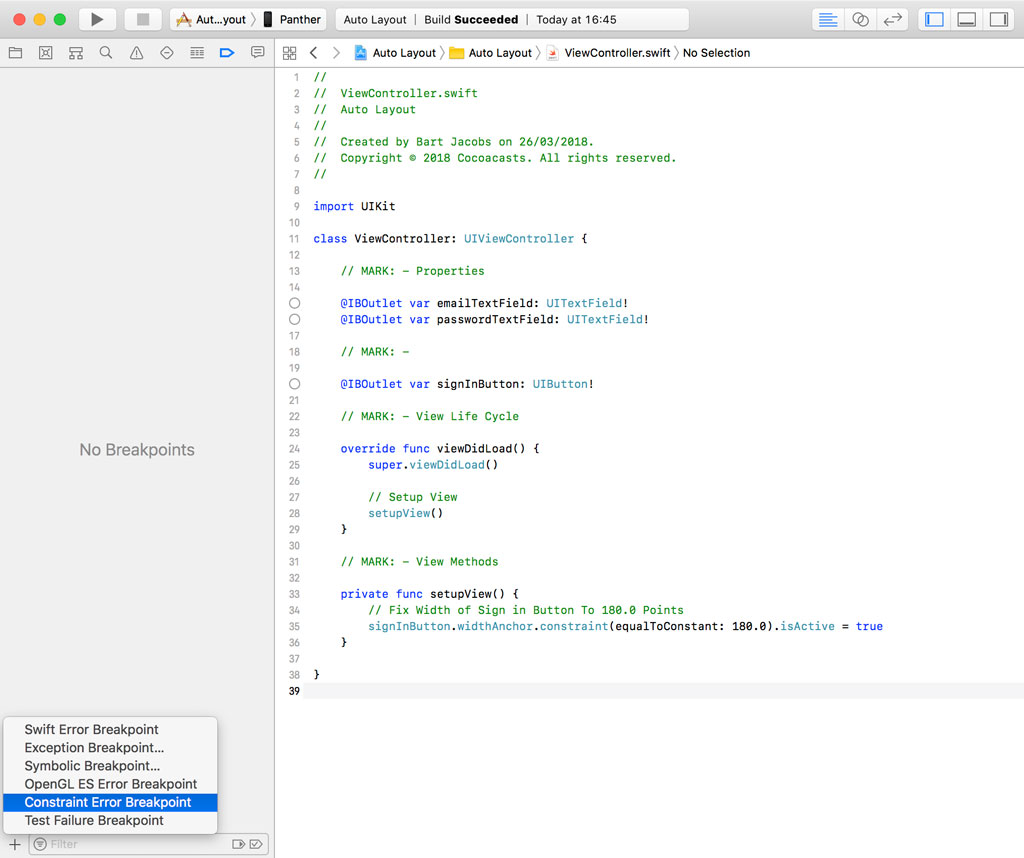
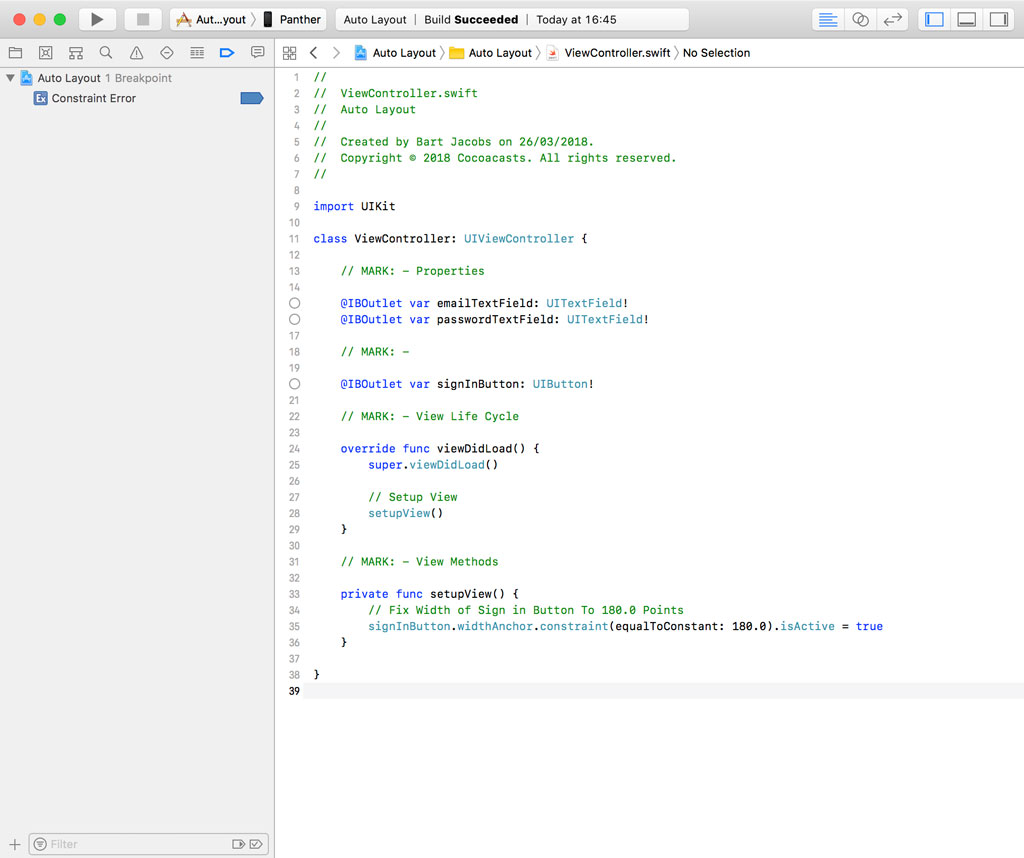
Open ViewController.swift, navigate to the setupView() method, and define a constraint that fixes the width of the sign in button to 180.0 points.
private func setupView() {
    // Fix Width of Sign in Button To 180.0 Points
    signInButton.widthAnchor.constraint(equalToConstant: 180.0).isActive = true
}
Run the application again to see the result. Even though the user interface looks fine, the output in the console tells a different story. If you've worked with Auto Layout, then you're probably familiar with the verbose, and often vague, Auto Layout errors.
Auto Layout[11649:6155735] [LayoutConstraints] Unable to simultaneously satisfy constraints.
    Probably at least one of the constraints in the following list is one you don't want.
    Try this:
        (1) look at each constraint and try to figure out which you don't expect;
        (2) find the code that added the unwanted constraint or constraints and fix it.
(
    "<NSLayoutConstraint:0x1c009c6b0 UITextField:0x106026a00.width == 200   (active)>",
    "<NSLayoutConstraint:0x1c409ae50 UITextField:0x10602ea00.width == UITextField:0x106026a00.width   (active)>",
    "<NSLayoutConstraint:0x1c409af40 UIButton:0x105b15470'Sign In'.width == UITextField:0x10602ea00.width   (active)>",
    "<NSLayoutConstraint:0x1c409b030 UIButton:0x105b15470'Sign In'.width == 180   (active)>"
)

Will attempt to recover by breaking constraint
<NSLayoutConstraint:0x1c009c6b0 UITextField:0x106026a00.width == 200   (active)>

Make a symbolic breakpoint at UIViewAlertForUnsatisfiableConstraints to catch this in the debugger.
The methods in the UIConstraintBasedLayoutDebugging category on UIView listed in <UIKit/UIView.h> may also be helpful.
The Auto Layout engine notifies us that it's unable to satisfy every constraint we defined. That isn't surprising since we fixed the width of the sign in button to 180.0 points in code and defined it to be equal to the top text field in Interface Builder. The top text field is 200.0 points wide.
The layout I created is very basic and the problem is easy to fix. But that's not always true. Layouts can get complex very quickly, which means it's important that you know how to efficiently debug Auto Layout issues.
Let's add a constraint error breakpoint to see if it can help us debug the problem. Open the Breakpoint Navigator on the left, click the + button in the lower left, and choose Constraint Error Breakpoint. Run the application to find out what happens.
Nothing happens. The constraint error breakpoint doesn't help us debug the Auto Layout issue. Let me show you why that is. The first time I used the constraint error breakpoint I was equally confused. After trying various tricks to make the constraint error breakpoint work, I reached out to Apple and a kind engineer showed me why the constraint error breakpoint wasn't behaving as expected.
Interacting With LLDB
To figure out what's happening, we need to interact with LLDB. Earlier in this series, I mentioned that LLDB is the true hero of this series. The debugging tools included in Xcode are powered by LLDB. To figure out what's happening, we need to ask LLDB for a list of breakpoints. This is easy. Pause the execution of the application, open Xcode's console, and execute the following command.
br list
This command returns a list of the breakpoints we set. LLDB shows us that one breakpoint is set. That makes sense. The problem is that the breakpoint has resolved to zero locations. Even though we set a breakpoint in the Breakpoint Navigator, it will never be hit because it didn't resolve to any locations.
To better understand what that means, we're going to set a breakpoint using LLDB. To set a breakpoint, we execute the breakpoint set command. To set a file and line breakpoint, we need to specify the file and line of the breakpoint. We set a breakpoint in ViewController.swift on line 25.
breakpoint set -f ViewController.swift -l 25
Notice that LLDB informs us that the breakpoint resolved to one location. Let's set another breakpoint. This time, however, we specify a line that doesn't exit.
breakpoint set -f ViewController.swift -l 1024
We successfully set the breakpoint, but it will never be hit because the breakpoint hasn't resolved to any locations in the codebase. The same is true for the constraint error breakpoint.
Another Example
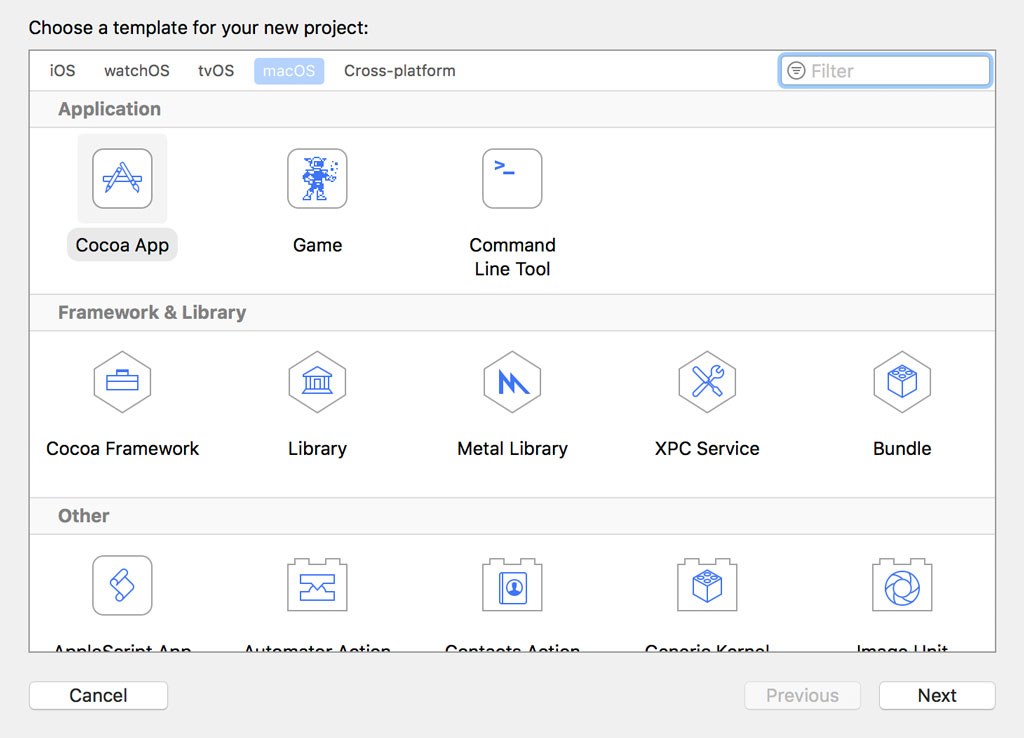
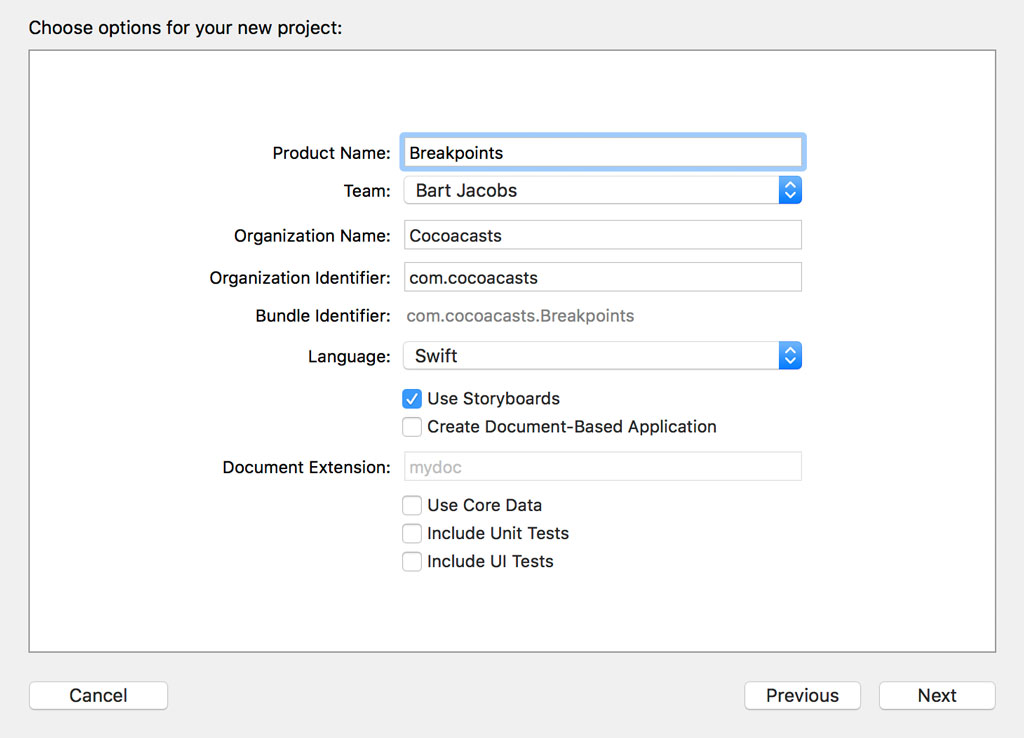
Let's dig a bit deeper. Stop the application and create a new project. Choose the Cocoa App template from the macOS section. Enter a product name and tell Xcode where you'd like to store the project files.
Open the Breakpoint Navigator on the left, click the + button in the lower left, and choose Constraint Error Breakpoint. Run the application.
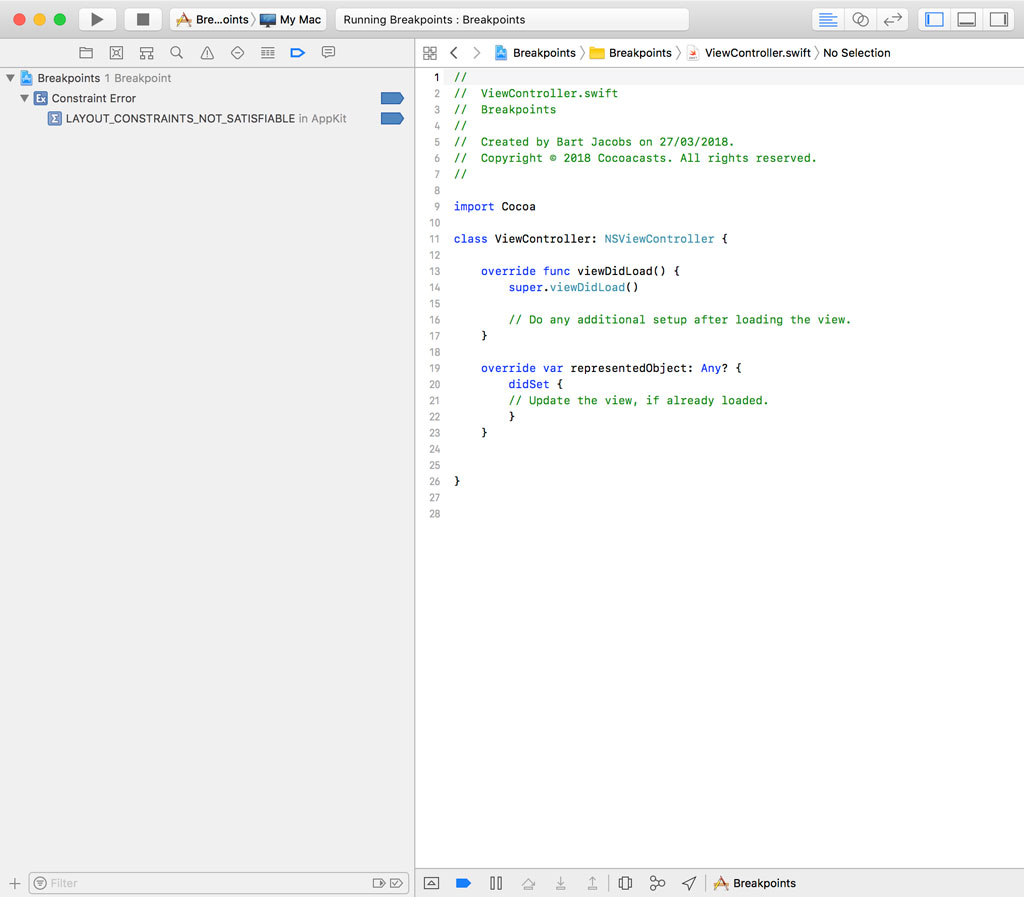
Open Xcode's console, pause the execution of the application, and execute the br list command. The output is quite different.
(lldb) br list
Current breakpoints:
1: name = 'LAYOUT_CONSTRAINTS_NOT_SATISFIABLE', locations = 1, resolved = 1, hit count = 0

  1.1: where = AppKit`LAYOUT_CONSTRAINTS_NOT_SATISFIABLE, address = 0x00007fff400d60b1, resolved, hit count = 0
The breakpoint is identical to the one we set in the iOS project. This time, however, the breakpoint resolved to one location. The location shows us why it didn't resolve to any locations in the iOS project. The location the breakpoint resolved to is located in the AppKit framework, the UIKit equivalent for macOS development.
Long story short, it seems the constraint error breakpoint is only useful for macOS development. I'm sure you agree that this is a bit confusing and it's unclear whether this is a bug in Xcode. Thanks to LLDB, we understand why the constraint error breakpoint isn't helping us debug the Auto Layout issue we're having.
Adding a Symbolic Breakpoint
Close the macOS project and head back to the iOS project. Run the application one more time and inspect the output in the console. Xcode shows us an error, but it also gives us a hint to help debug the issue. Xcode suggests adding a symbolic breakpoint. If you've watched the previous episodes, then you know what to do.
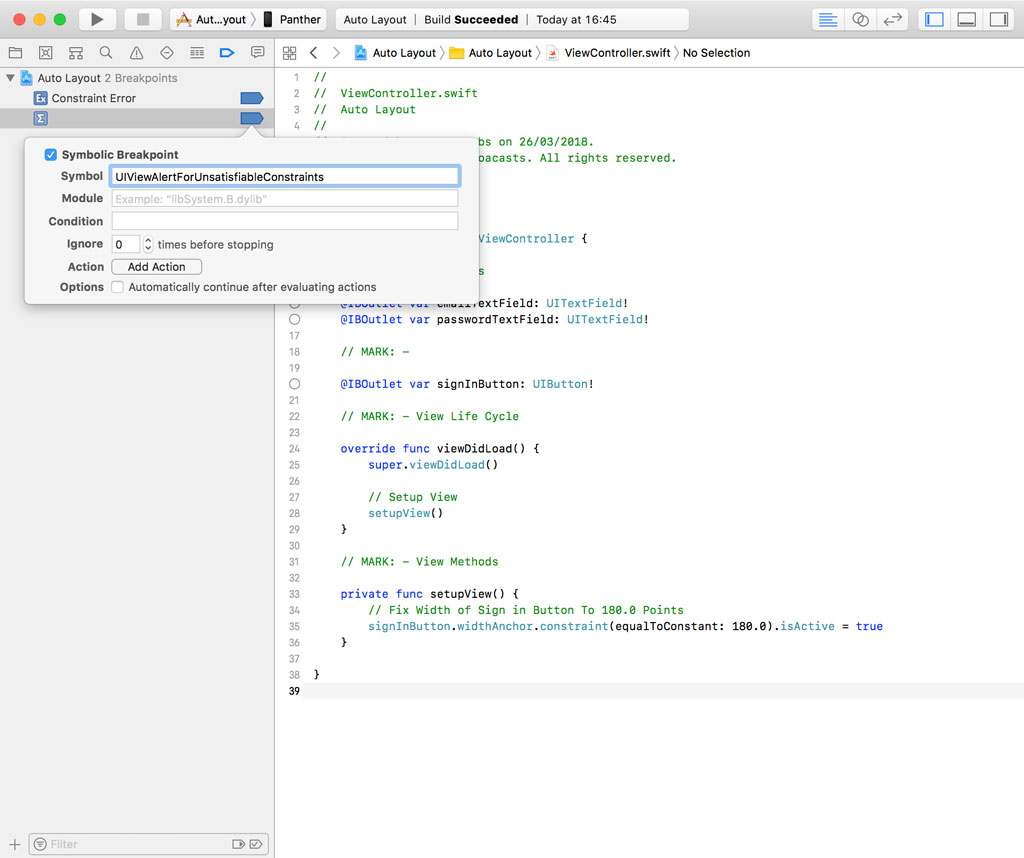
Open the Breakpoint Navigator and define a symbolic breakpoint at UIViewAlertForUnsatisfiableConstraints. Run the application to see the result.
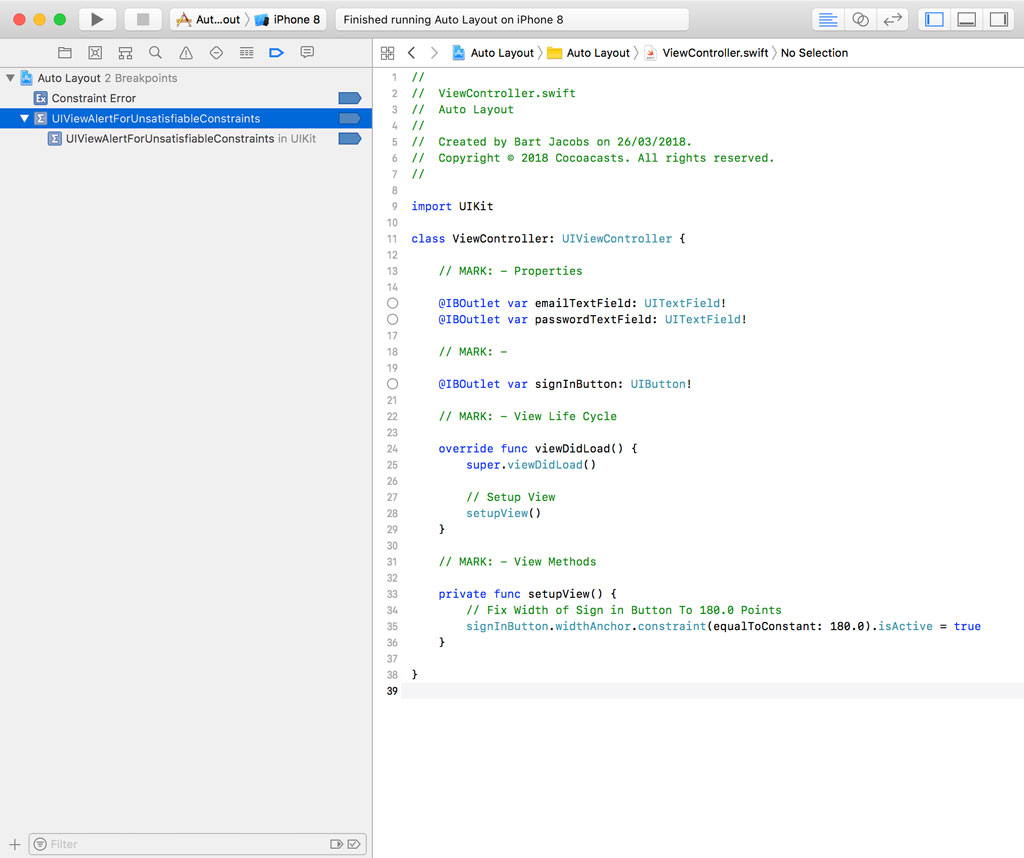
The Breakpoint Navigator shows us that the symbolic breakpoint resolved to one location in the UIKit framework.
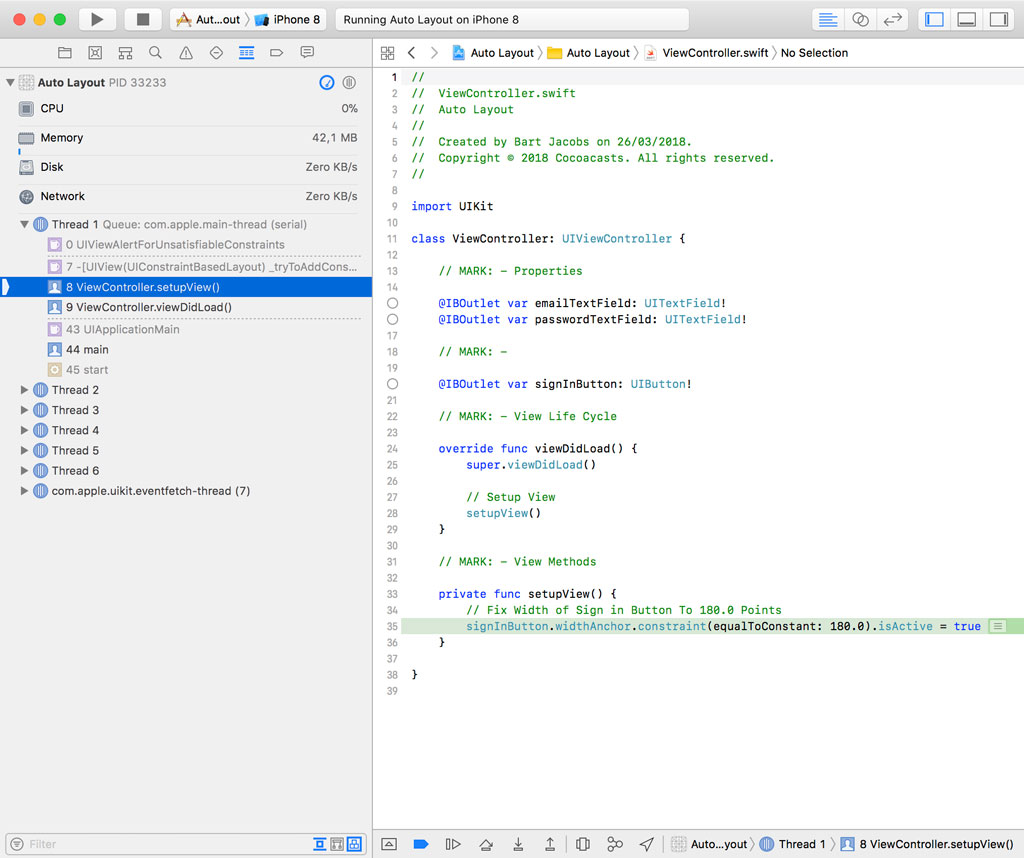
The debugger interrupts the execution of the application as expected, pointing us in the direction of the problem.
What's Next
Debugging Auto Layout issues isn't always easy and breakpoints can help you with this task. Xcode's view debugger, however, is often a useful addition to debug user interface issues. In the next episode, we take a look at debugging user interfaces with the view debugger.