The past episodes of this series have illustrated how useful breakpoints can be for debugging problems. But Xcode has more in store for us. Not every problem can or should be debugged with breakpoints. Issues related to the user interface of your application are often best tackled with Xcode's built-in view debugger. In this episode, we explore the view debugger built into Xcode.
Exploring the View Debugger
Let's take Cloudy as an example. Cloudy fetches weather data from the Dark Sky API and shows the user the current weather conditions as well as a weather forecast.
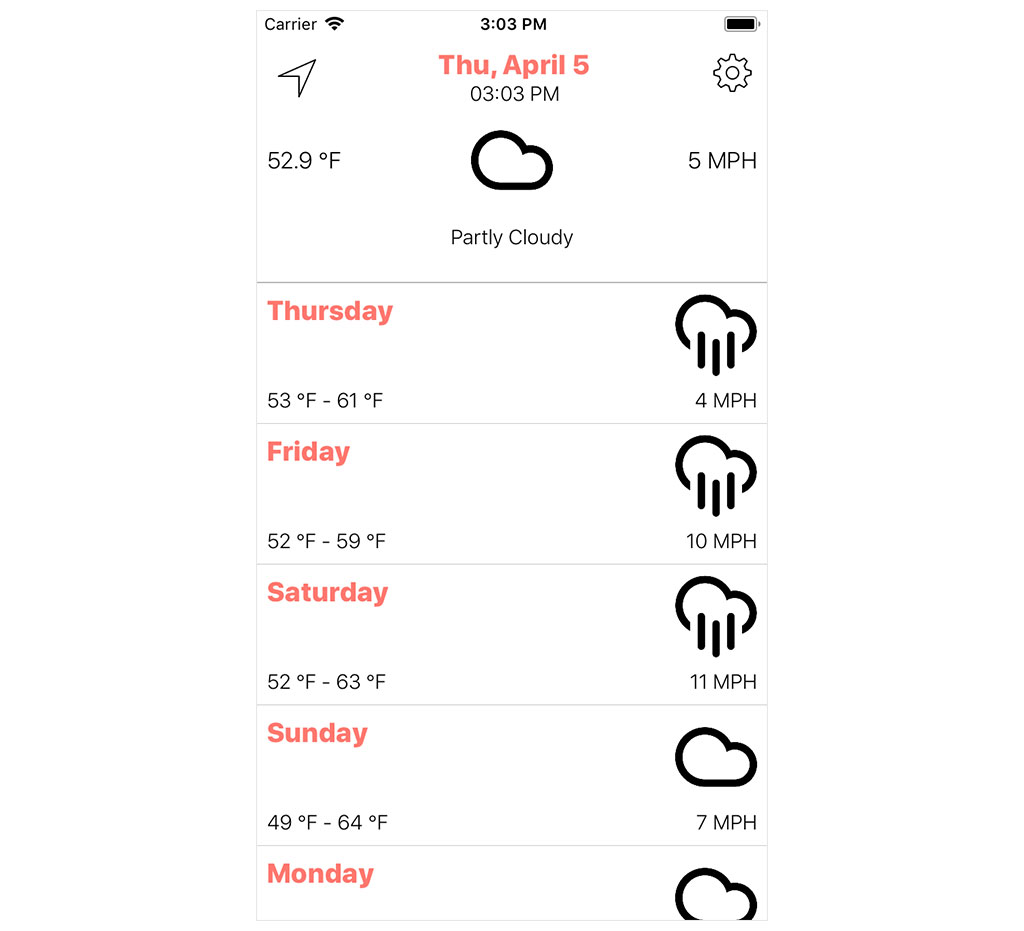
To show you how to leverage Xcode's view debugger, I've tampered with Cloudy and sabotaged the user interface. We use the view debugger built into Xcode to reveal and resolve the user interface issues I introduced in Cloudy. Download the starter project of this episode if you'd like to follow along. Let's find out how the view debugger can help us debug user interface issues.
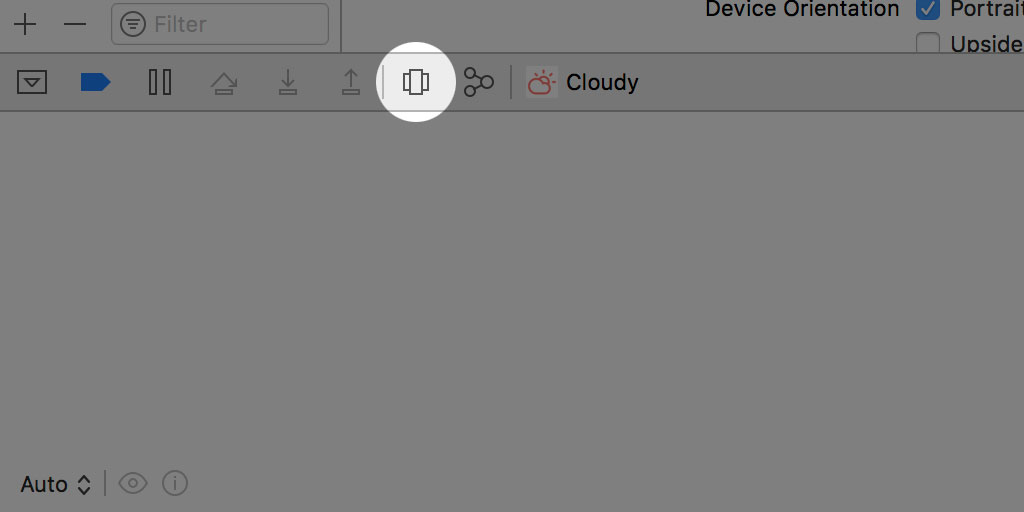
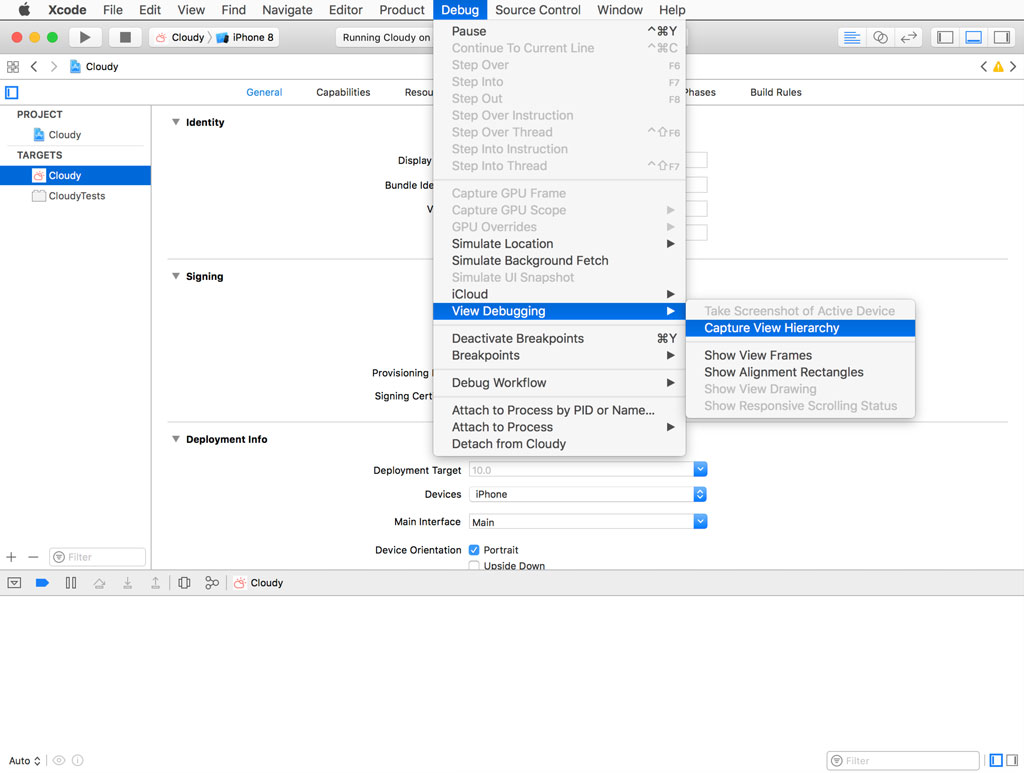
Run Cloudy in the simulator and click the Debug View Hierarchy button in the debug bar at the bottom. You can also select View Debugging > Capture View Hierarchy from Xcode's Debug menu.
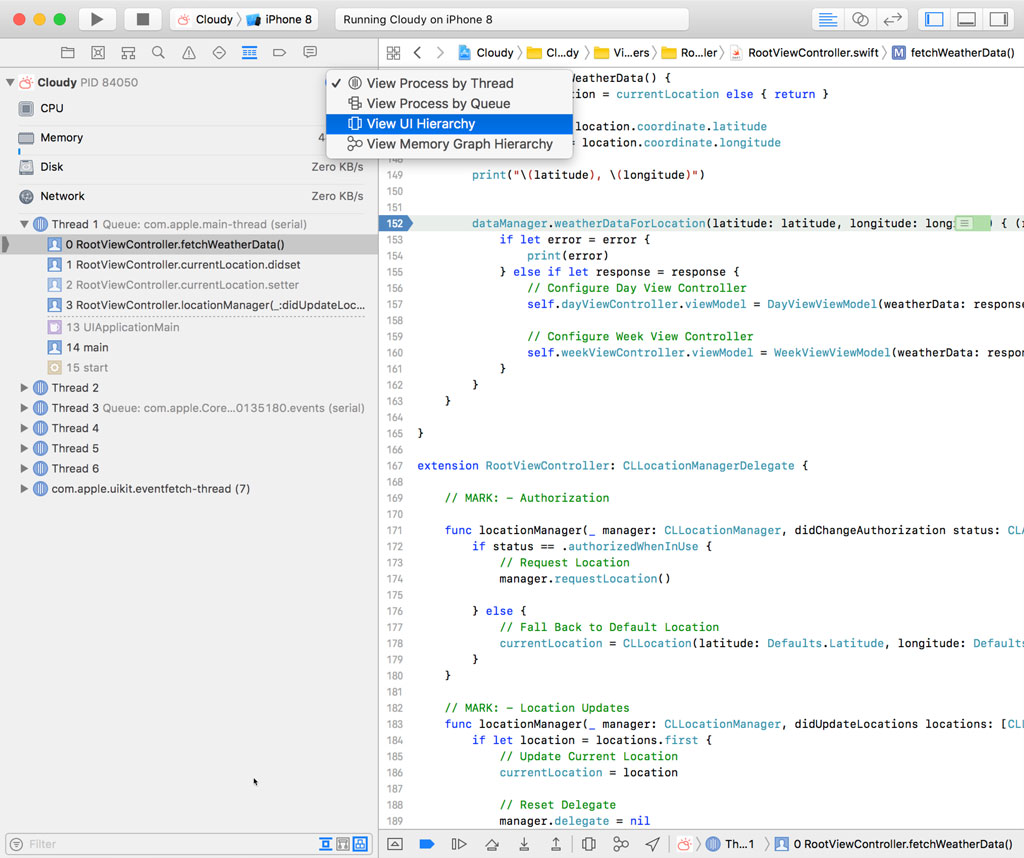
There's also a lesser known option to debug the view hierarchy of an application. Stop the application, open RootViewController.swift, and add a breakpoint on line 152. Run the application. The application is interrupted when the debugger hits the breakpoint. That's no surprise.
Open the Debug Navigator on the left, click the View process in different ways menu, and select View UI Hierarchy.
The result is identical to clicking the Debug View Hierarchy button in the debug bar. The difference is that you can accurately control when Xcode takes a snapshot of the view hierarchy of your application's window. This approach is very convenient if the problem you're debugging is short-lived, intermittent, or occurs at a specific moment in the application's life cycle.
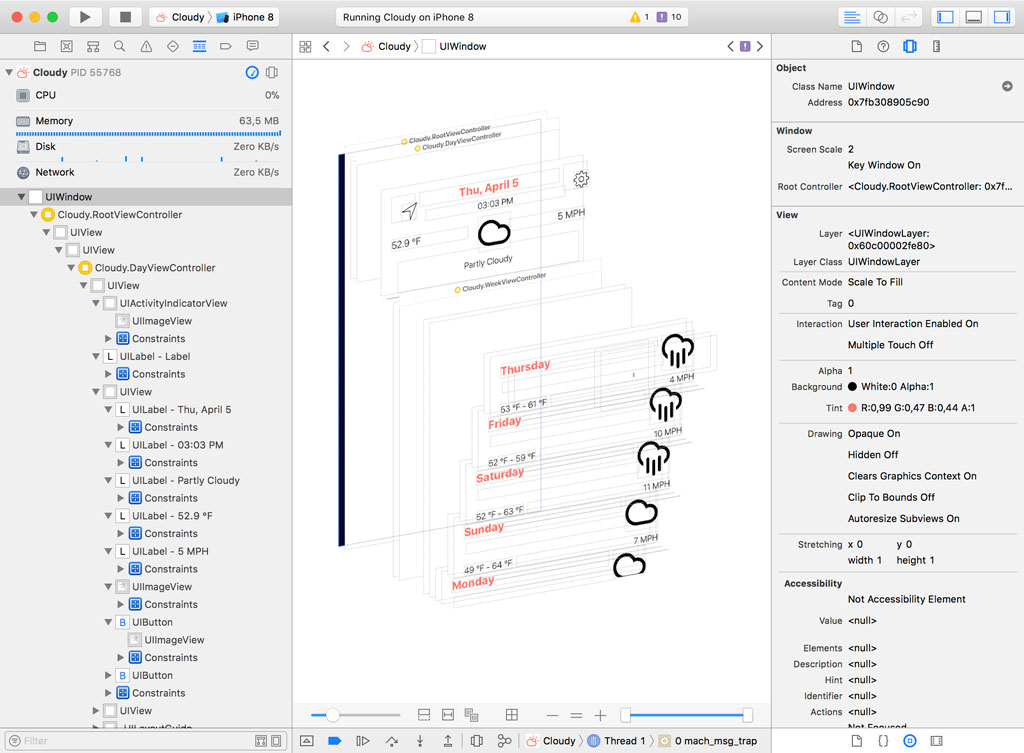
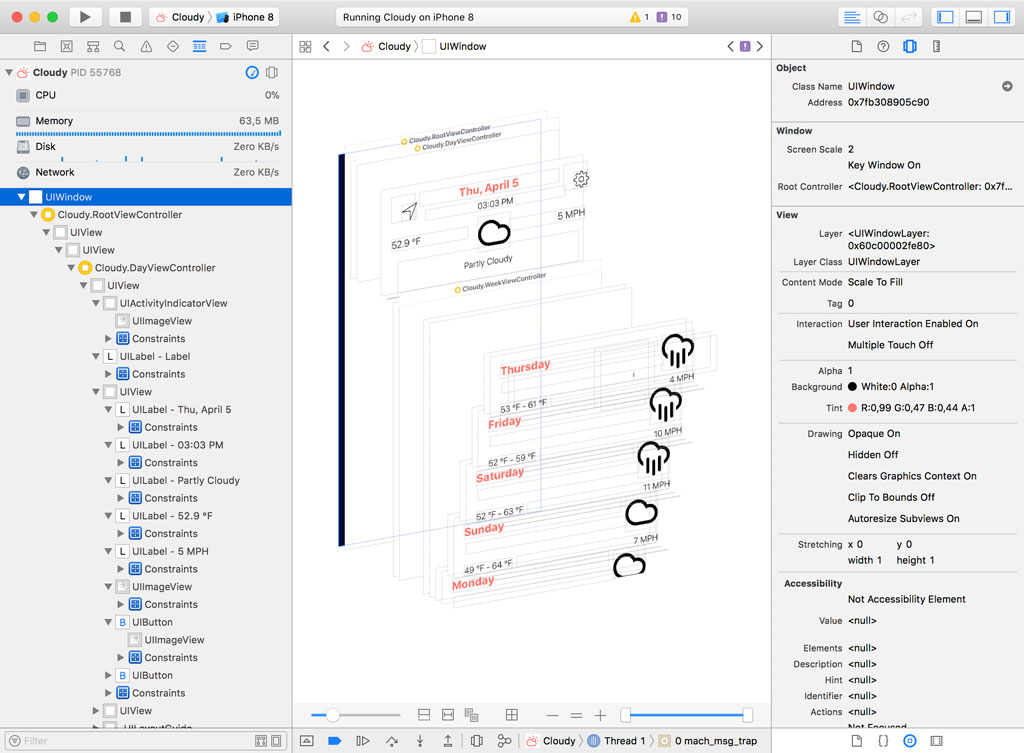
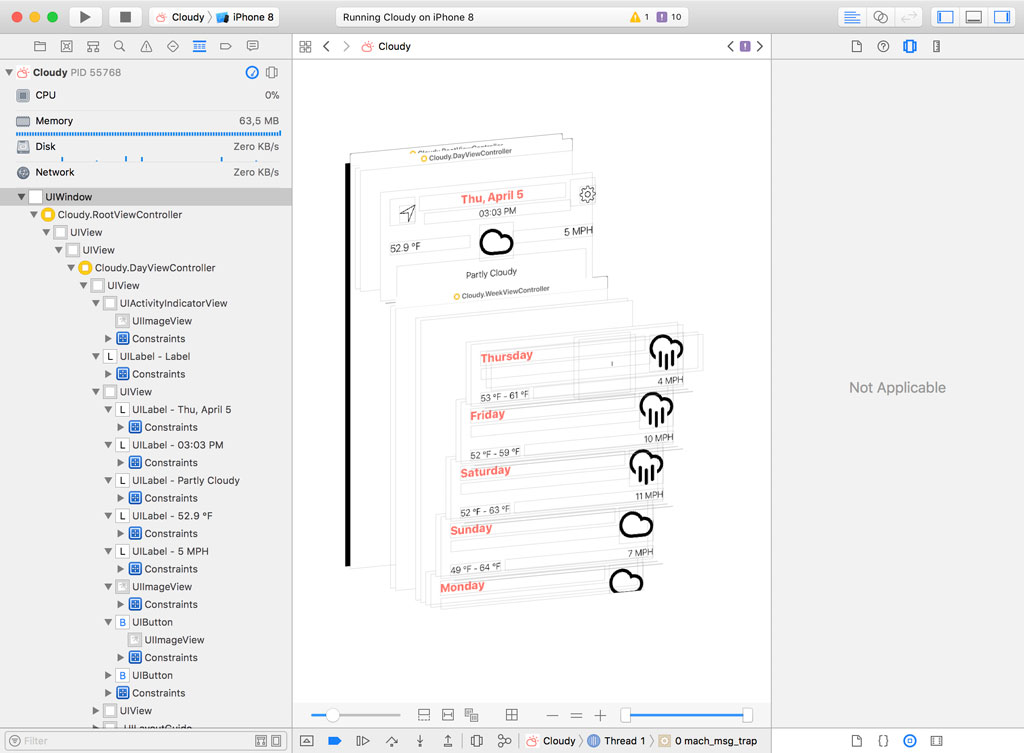
To debug user interface issues, Xcode takes a snapshot of the view hierarchy of the application's window and presents us with a two- or three-dimensional rendering of the view hierarchy in Xcode's main window.
Notice that Xcode paused the execution of the application to take a snapshot of the view hierarchy. This means that you can't interact with the application as long as you're debugging the view hierarchy. To exit the view debugger, you stop the application or click the continue button in the debug bar at the bottom.
Let's take a moment to explore the user interface of the view debugger. The main window shows us a two- or three-dimensional rendering of the view hierarchy of the application's window. The Debug Navigator on the left displays a hierarchical list of the view hierarchy. The Object and Size Inspectors on the right show information about the currently selected element. Let's start with the Debug Navigator.
Debug Navigator
The Debug Navigator on the left displays a hierarchical list of the view hierarchy. It shows the relationships between the views in the view hierarchy and, as of Xcode 9, it also shows which view controller manages which views.
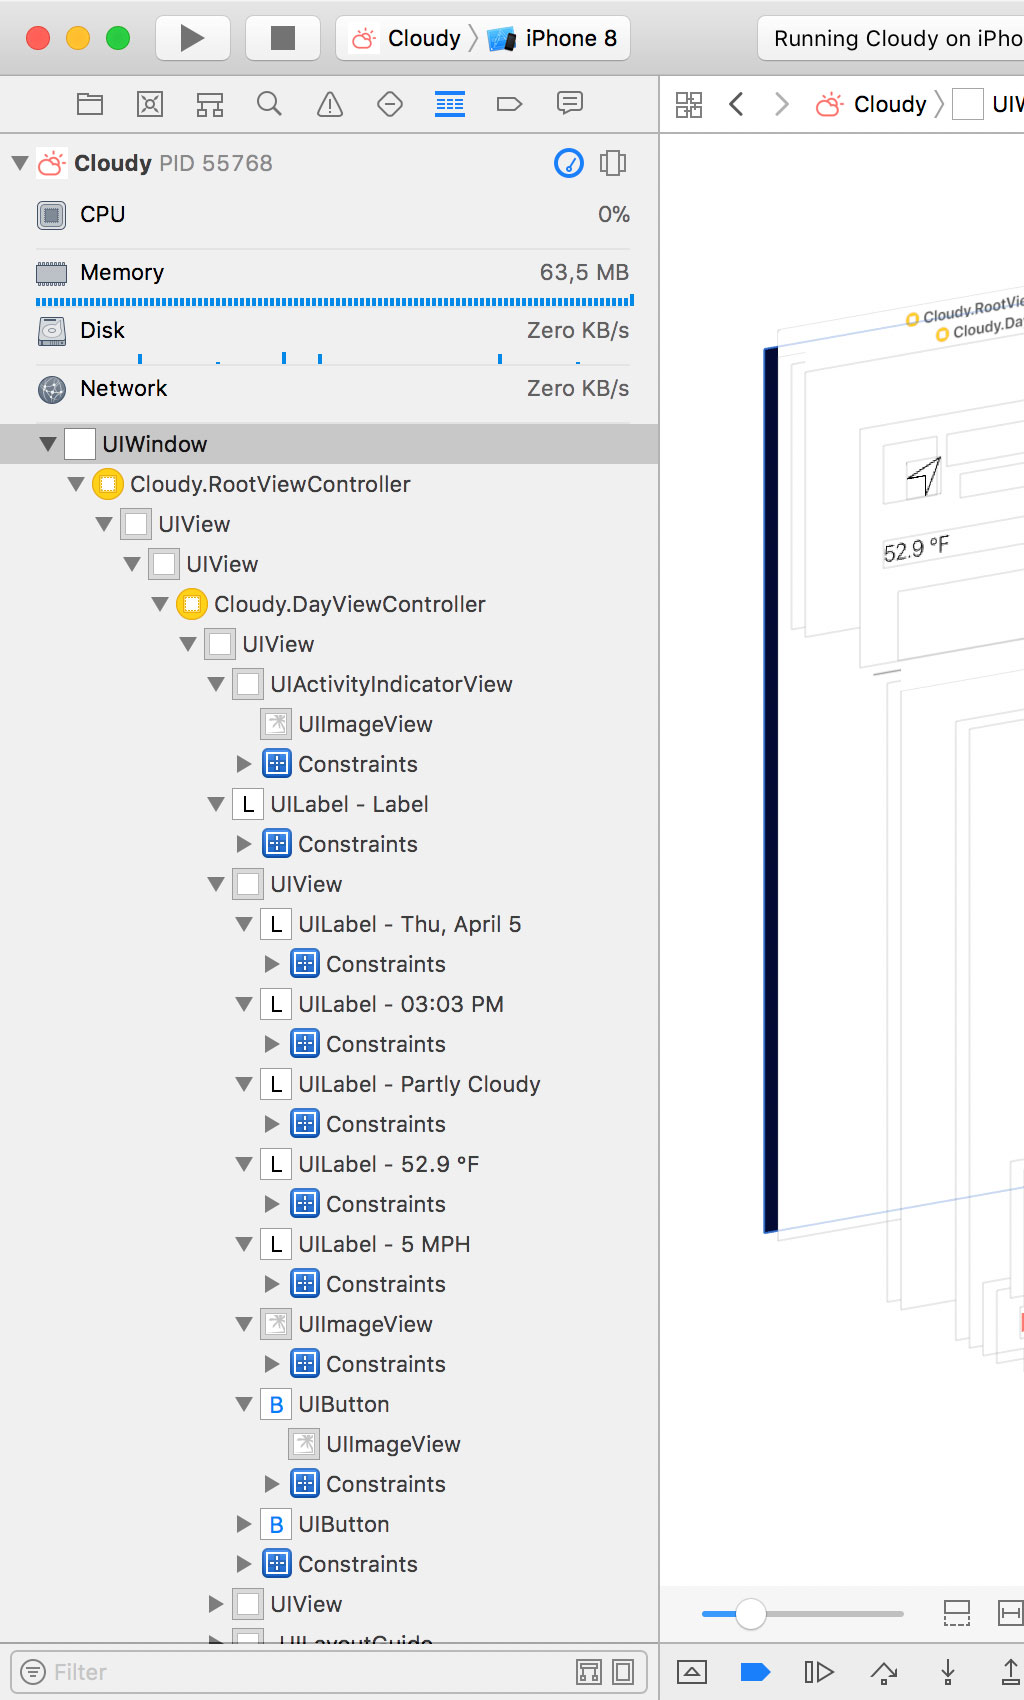
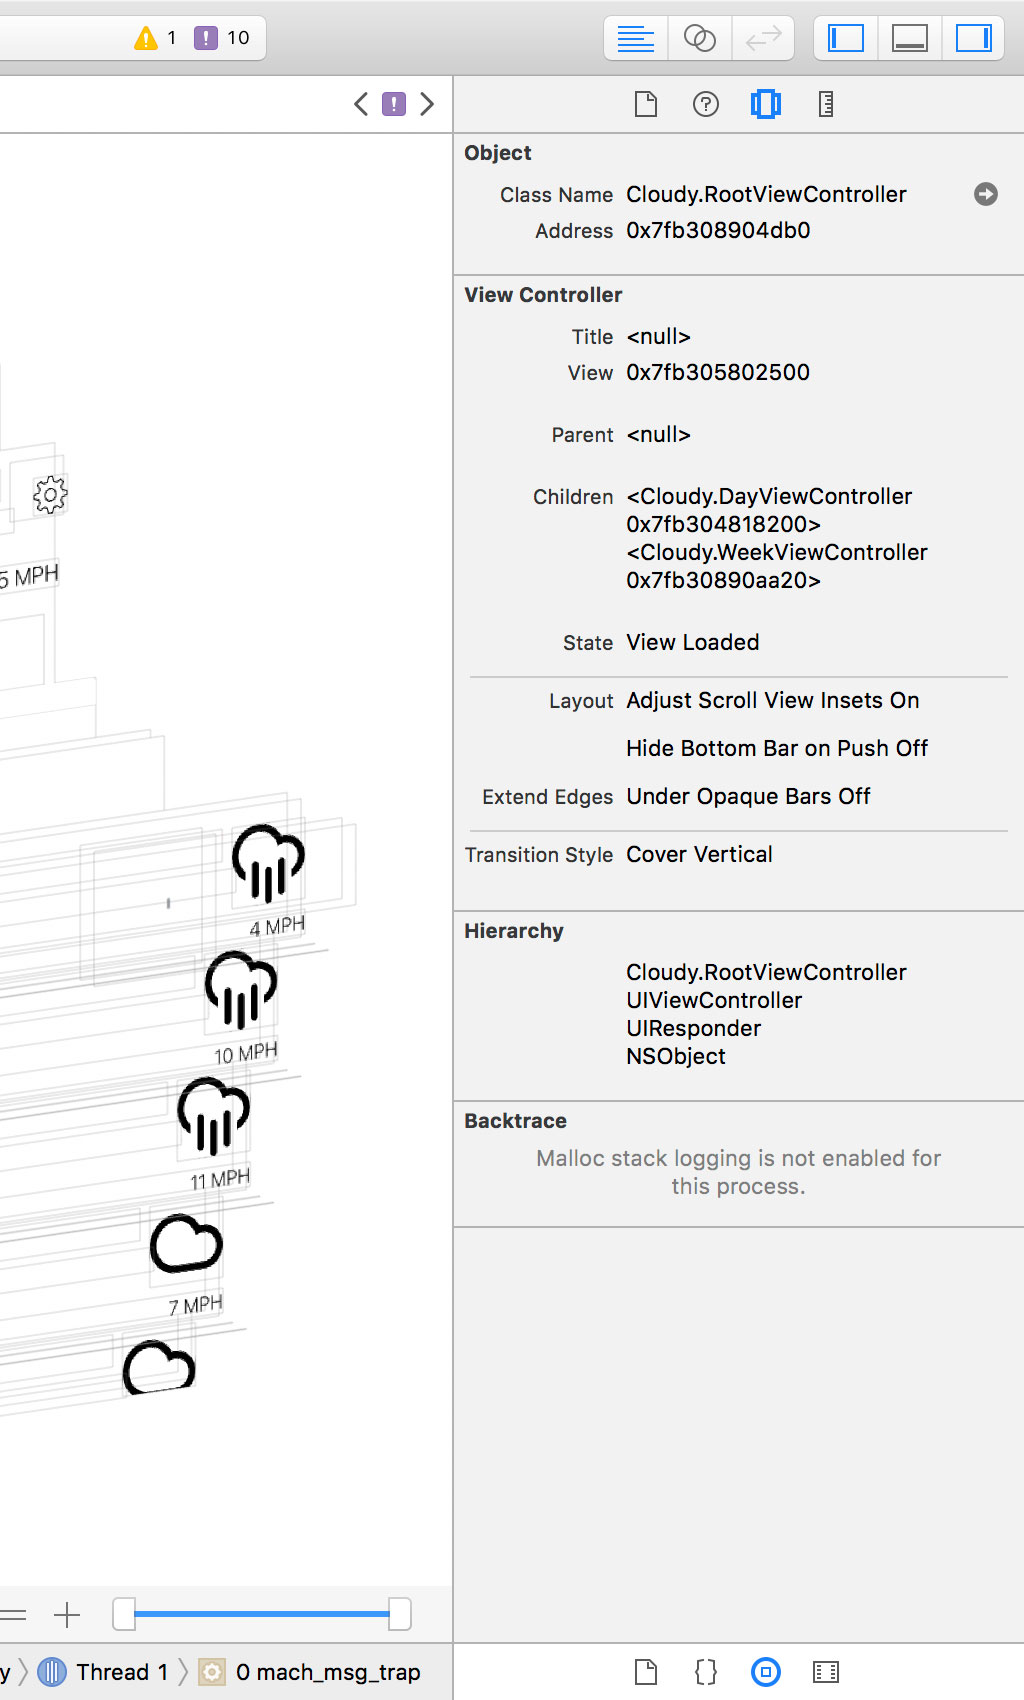
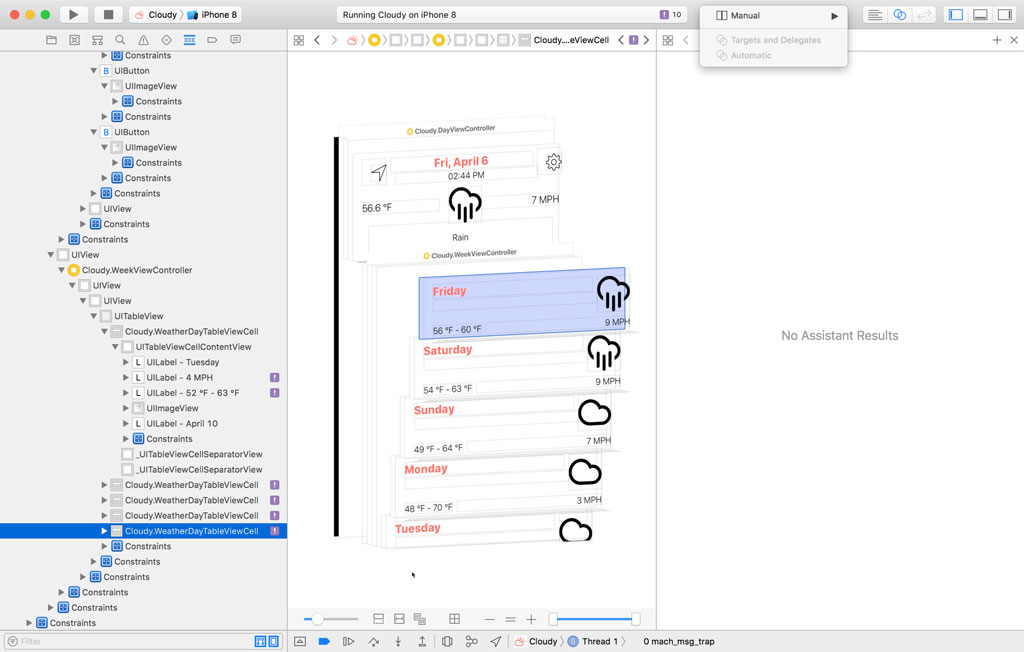
Cloudy takes advantages of view controller containment, which is immediately obvious if we inspect the view hierarchy on the left. An instance of the RootViewController class contains two child view controllers, an instance of the DayViewController class and an instance of the WeekViewController class.
This subtle feature is very convenient if you're working with view controller containment, but also if you're browsing a foreign codebase. It immediately shows you which section of the user interface is managed by which view controller. The view controllers are also visible in Xcode's main window.
The filter bar at the bottom of the view hierarchy is a convenient tool to find the view or views you're looking for. The text filter allows you to filter the view hierarchy based on a number of criteria, including the class name, the text of labels and buttons, and even the memory address of an object. Filtering the view hierarchy by class name also takes the superclass of an object into account.
The buttons on the right of the text filter are enabled by default. When enabled the Show primary views button hides views that are subviews of system views. A UIButton instance, for example, manages a UILabel instance for displaying the title of the button. That UILabel instance is hidden in the view hierarchy if the Show primary views button is enabled.
When enabled the Show only displayed views button hides views that are hidden, that is, views that have their isHidden property set to true. Disabling the Show only displayed views button is convenient if you're not seeing one or more views that should be visible.
Main Window
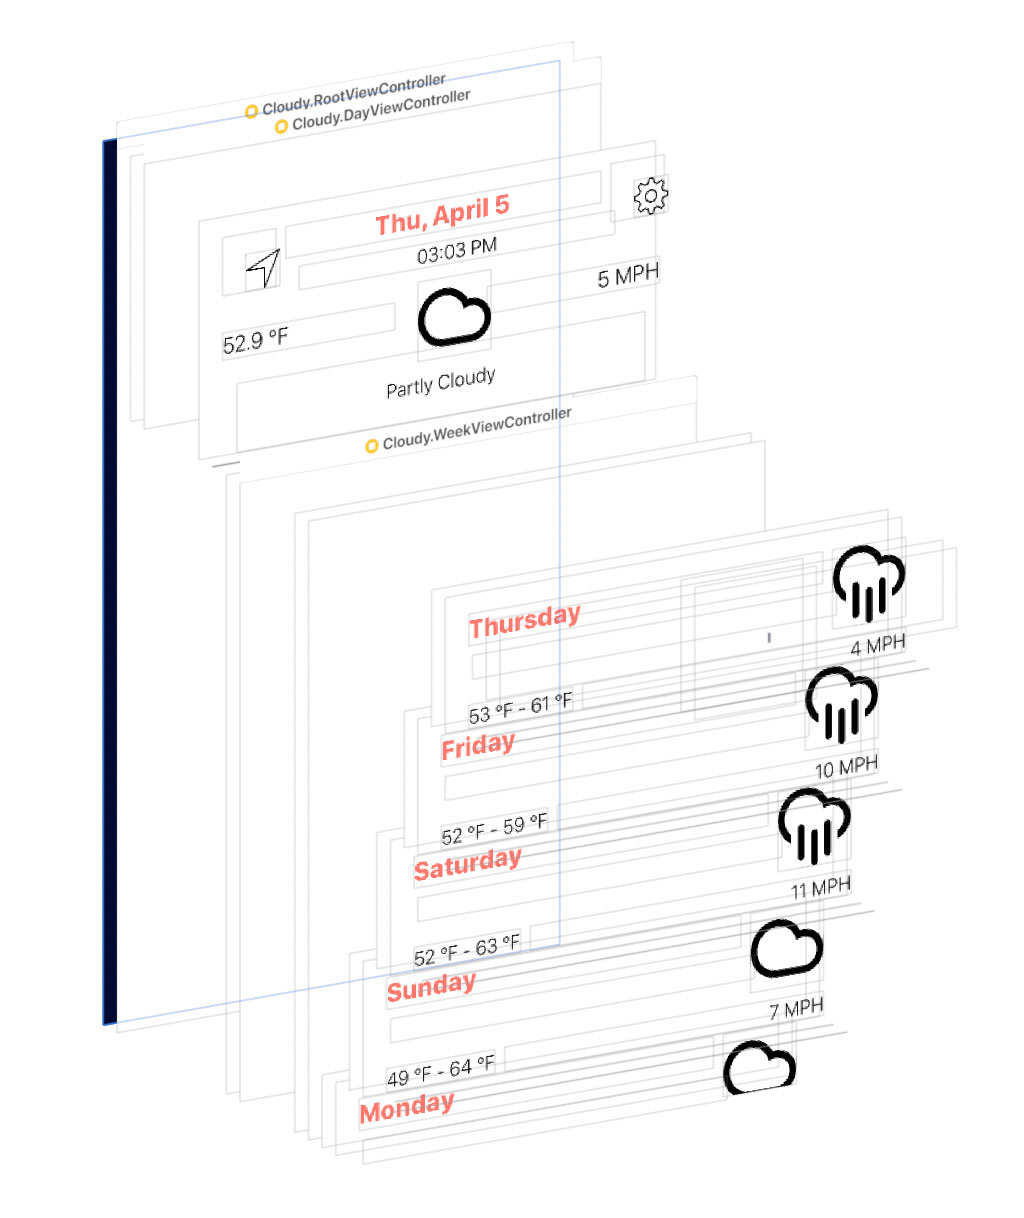
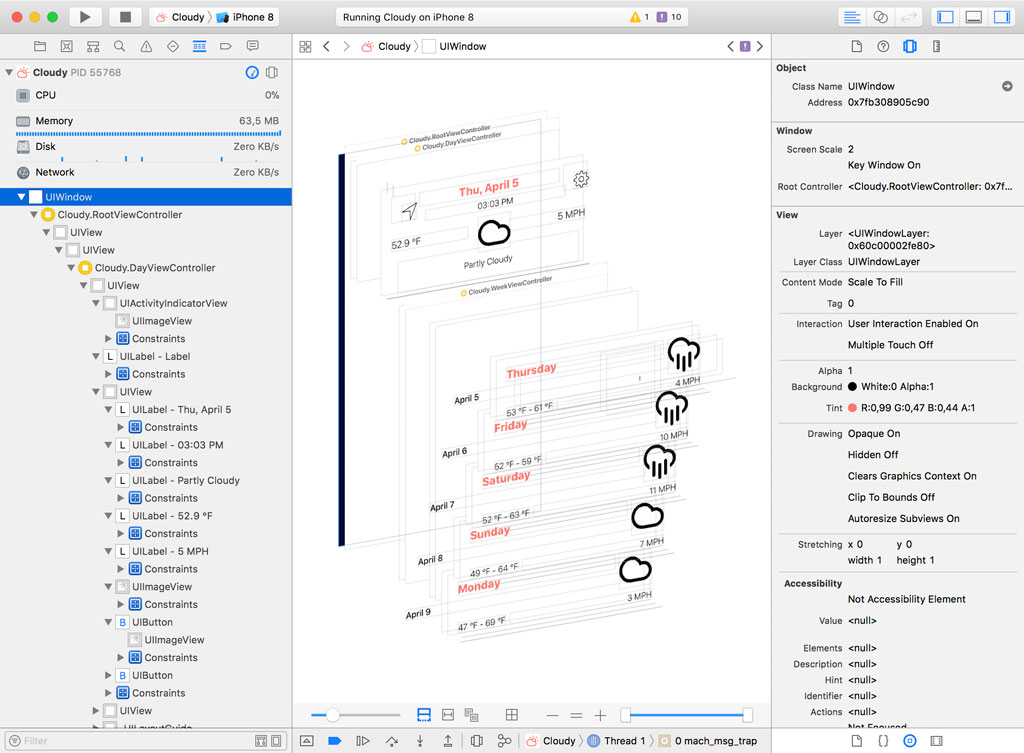
Xcode's main window shows us the heart of the view debugger, a two- or three-dimensional rendering of the view hierarchy of the application's window. We can rotate the view hierarchy to change the viewing angle and the view controls at the bottom of the main window give us more options to control what is rendered in the main window.
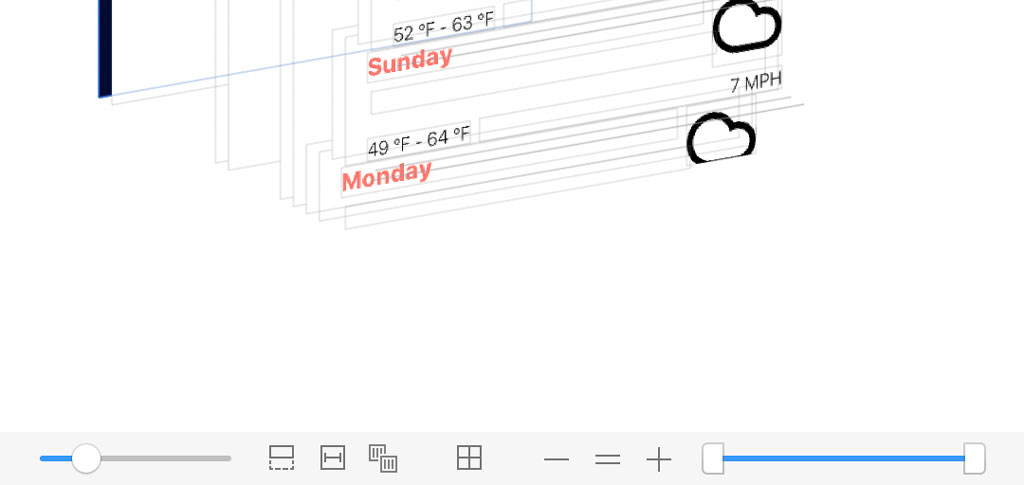
With the slider on the left, we can adjust the spacing between the views of the view hierarchy. This is useful if you're working with a complex view hierarchy with dozens or hundreds of views.
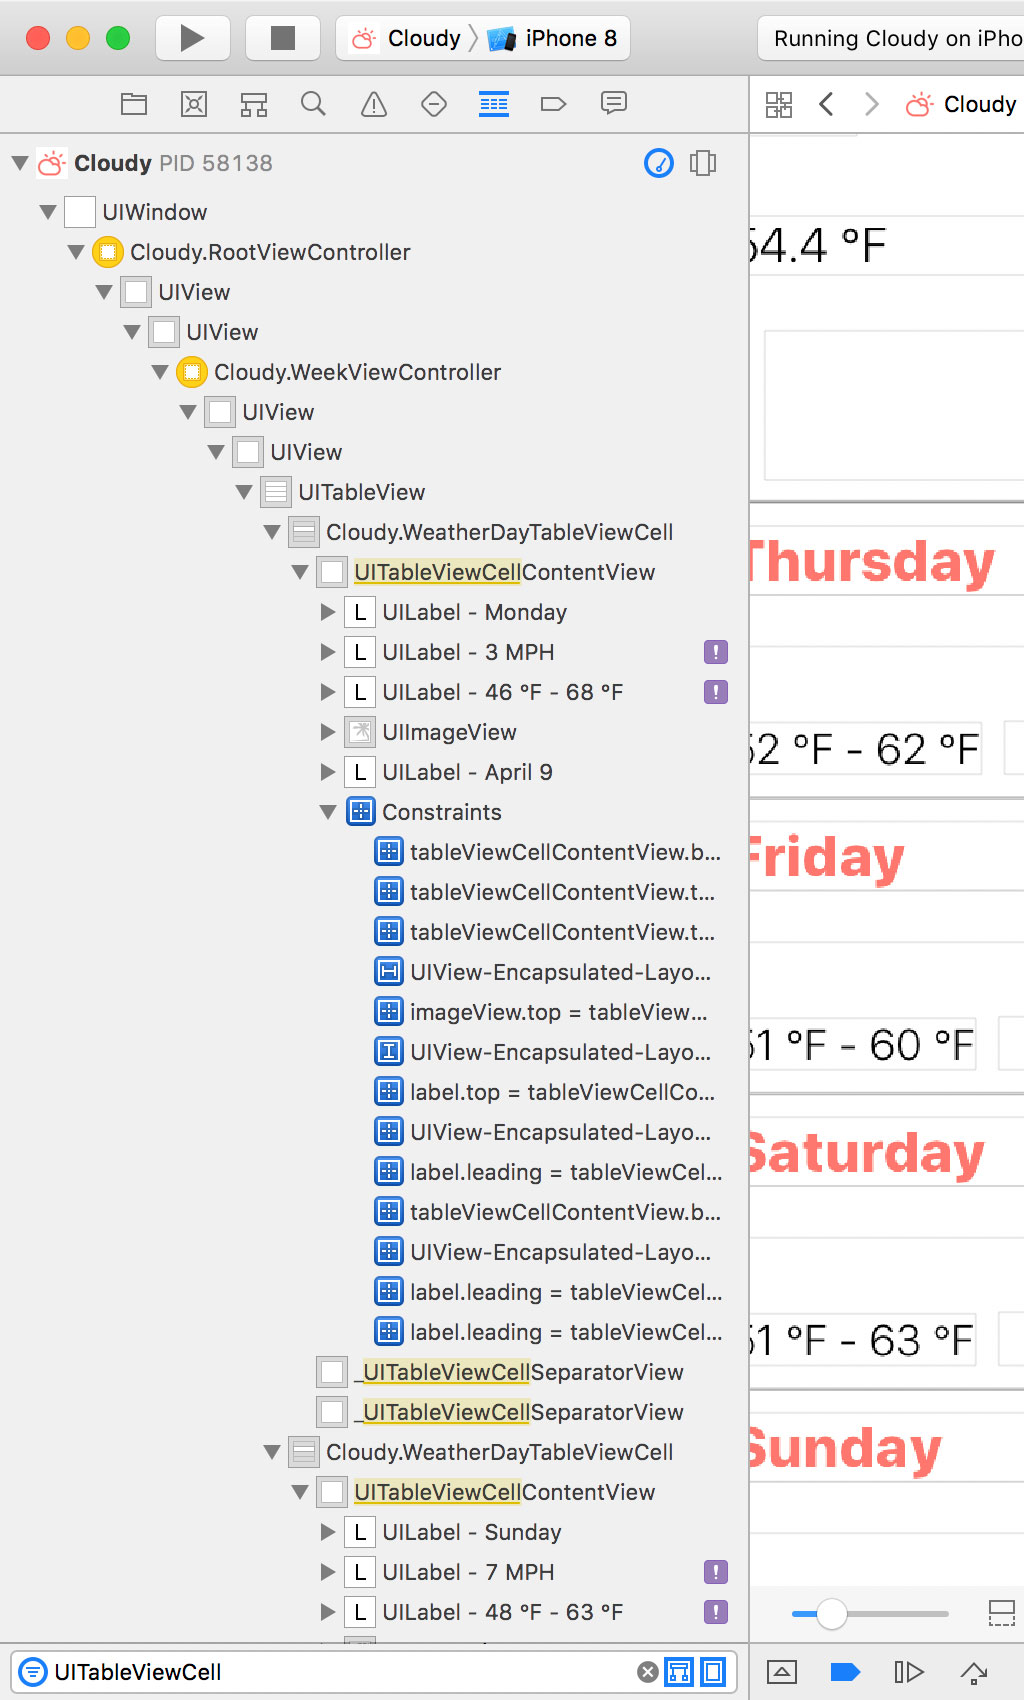
The buttons on the right of the slider give us more control about what's displayed in the main window. The first button from the left shows clipped content if enabled. Notice that the lower half of the bottom table view cell is only partially visible. If we click the Show Clipped Content button, we can see the clipped content of the table view cell.
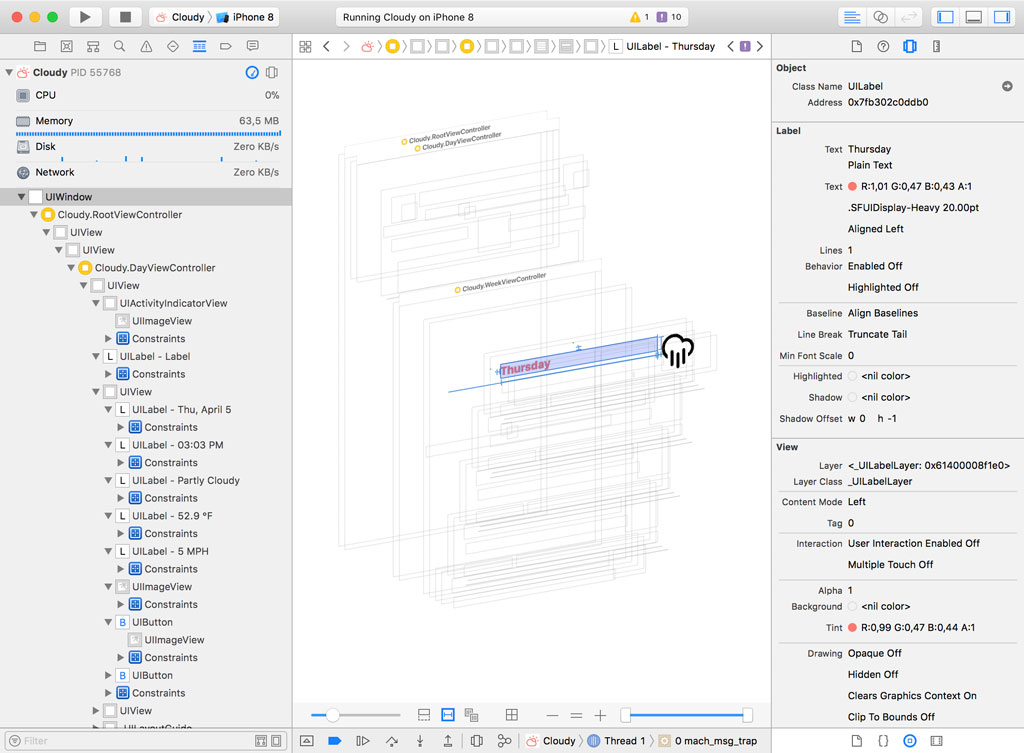
The next button shows the constraints for the currently selected view. Select the topmost label of a table view cell and click the Show Constraints button. The view debugger highlights the selected view and shows its constraints.
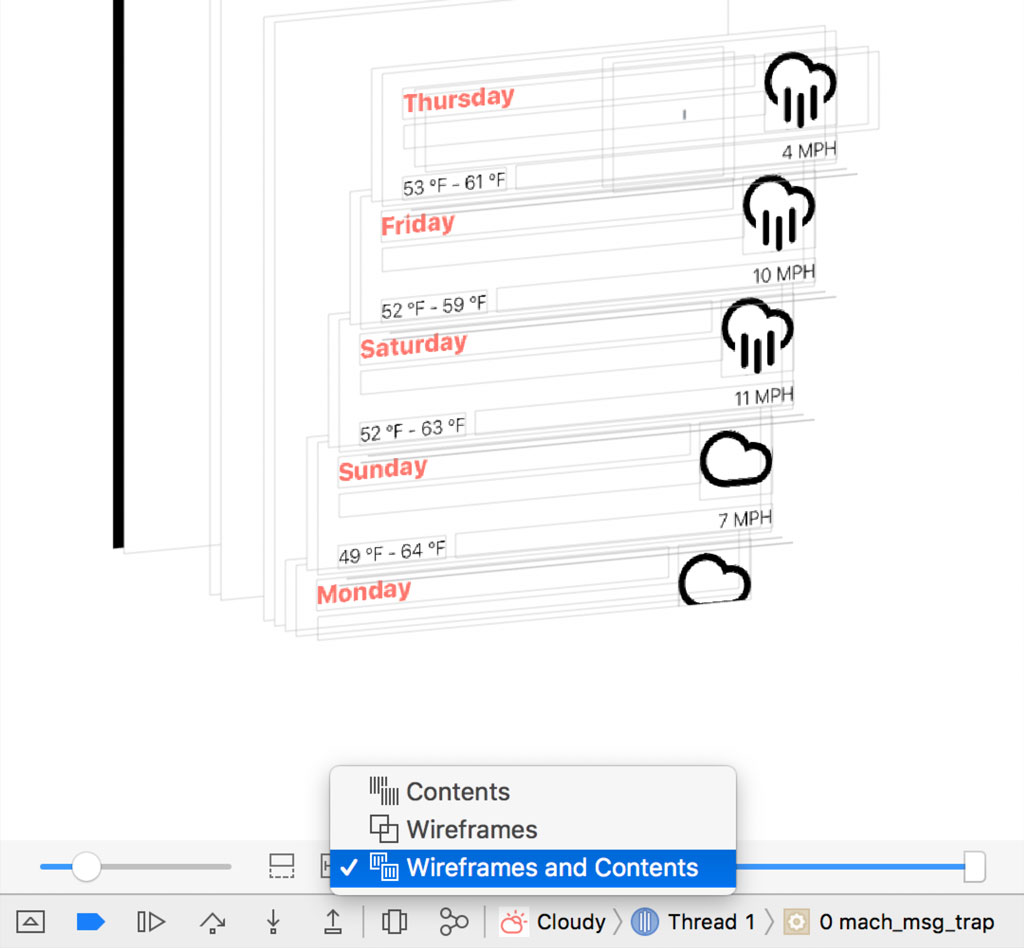
By default the view debugger shows the contents as well as the wireframe of each view in the view hierarchy. The view debugger supports three view modes, Contents, Wireframes, and Wireframes and Contents.
While it can be useful to only see the contents or wireframes of the views in the view hierarchy, most of the time you want to see both wireframes and contents.

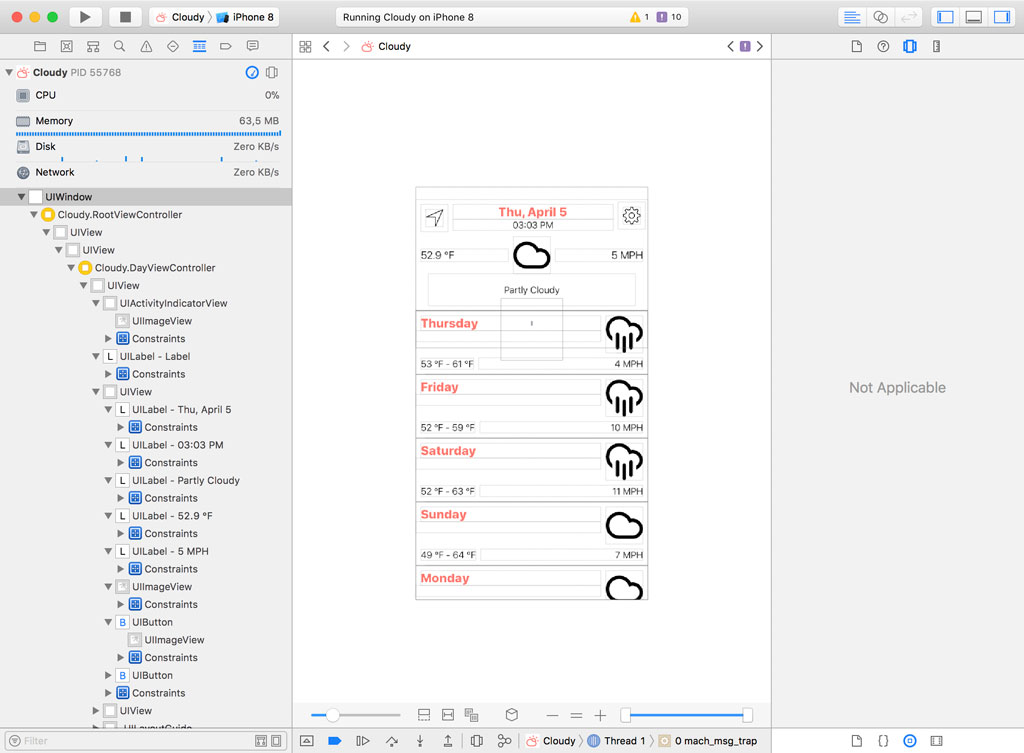
You can switch between a two-dimensional and a three-dimensional rendering of the view hierarchy by clicking the Orient to 2D/3D button. The 3D mode is very useful, but it can sometimes be easier to debug issues in the 2D mode, for example, to inspect the alignment of several views.
The next three buttons allow you to zoom in and out or show the view hierarchy at its actual size. You can also use the pinch gesture, use the Command key in combination with the +, -, and = keys, or press the Option key while scrolling to zoom in and out. The latter is my preferred way of zooming in and out in the view debugger.
The slider on the right is used to focus on a subset of the view hierarchy. This is useful if you're working with a complex view hierarchy and want to ignore any views you're not interested in.
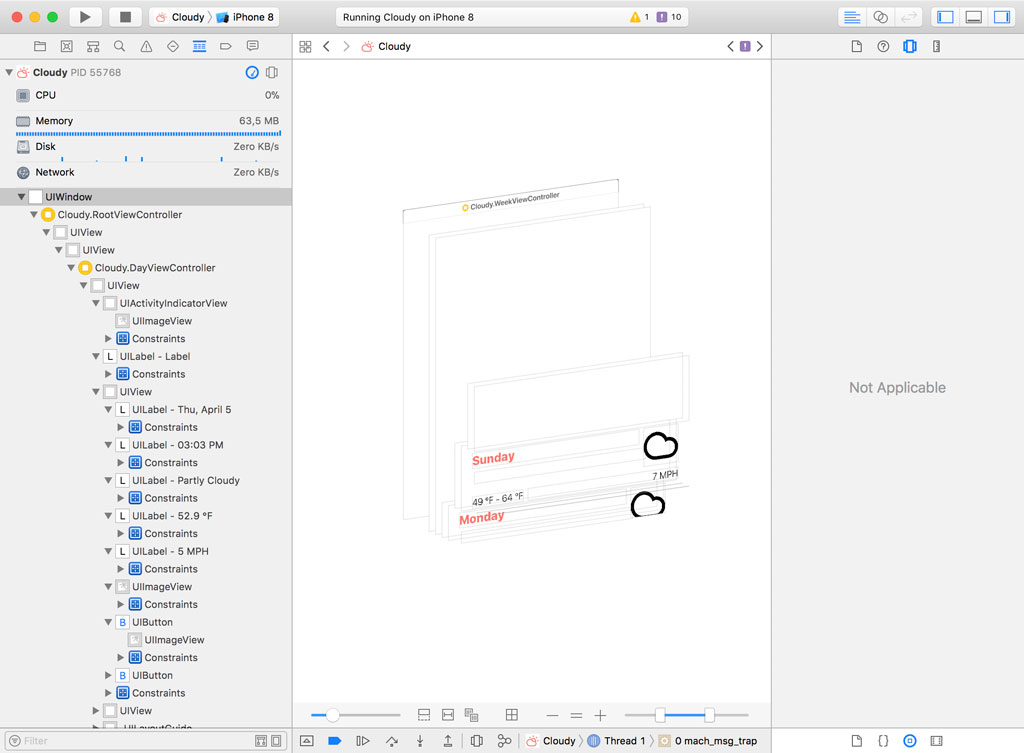
There are other and more convenient options to focus on a subset of the view hierarchy. You can use the jump bar at the top of the main window or you can double-click a view in the Debug Navigator or in the main window. Double-clicking a view in the main window is quick and often the most intuitive approach. To reset the main window, you click the small close button in the Debug Navigator on the left.
Right-clicking an element in the Debug Navigator or the main window brings up a contextual menu with convenient shortcuts. You can print the description of the element to the console, which is identical to LLDB's po command, focus on the selected element, and show its constraints.
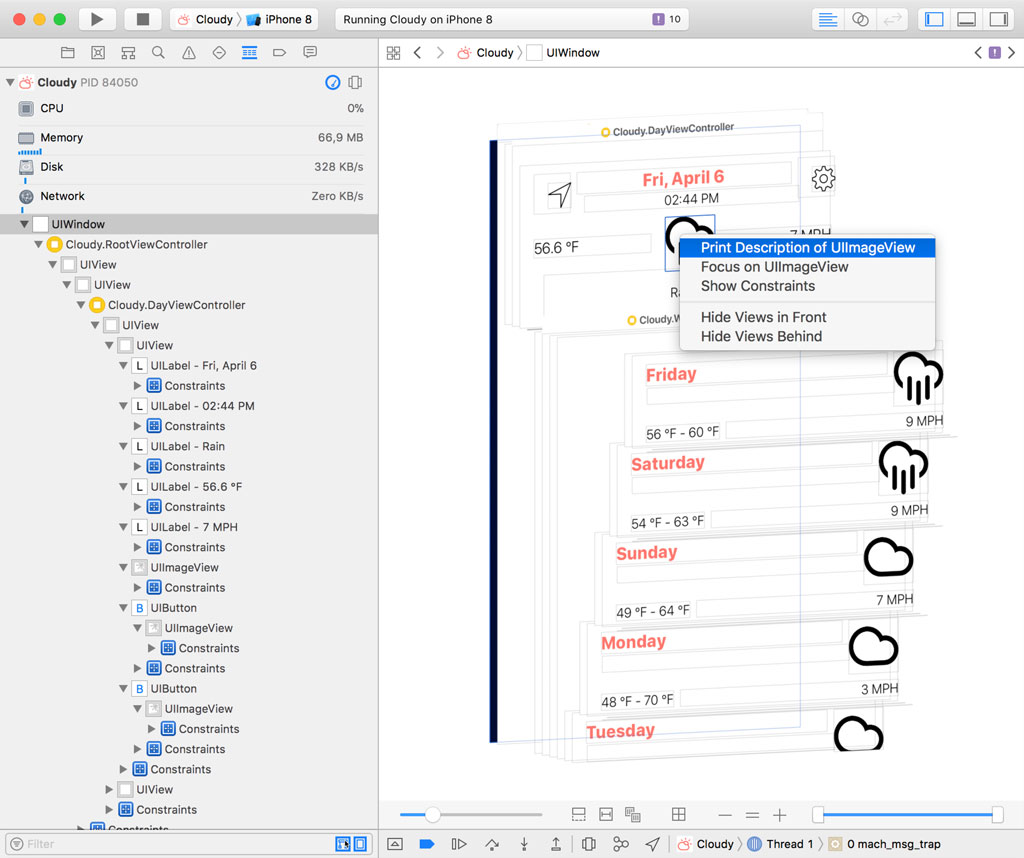
Also convenient are the options to hide the views behind or in front of the selected view, which is functionally identical to the rightmost slider at the bottom of the main window.
It can sometimes be tedious to find the selected element in the main window in the Debug Navigator on the left. You can reveal the selected element by pressing Shift, Command, and D. This is a keyboard shortcut for the Reveal in Debug Navigator menu item of the Navigate menu.
Object and Size Inspectors
The inspectors on the right are automatically populated if you select an element in the Debug Navigator or in the main window. The Object Inspector shows you a wide range of information about the selected element. If you select a custom class, such as a UITableViewCell subclass, you can quickly navigate to the implementation of the class by clicking the arrow in the Object section of the Object Inspector.
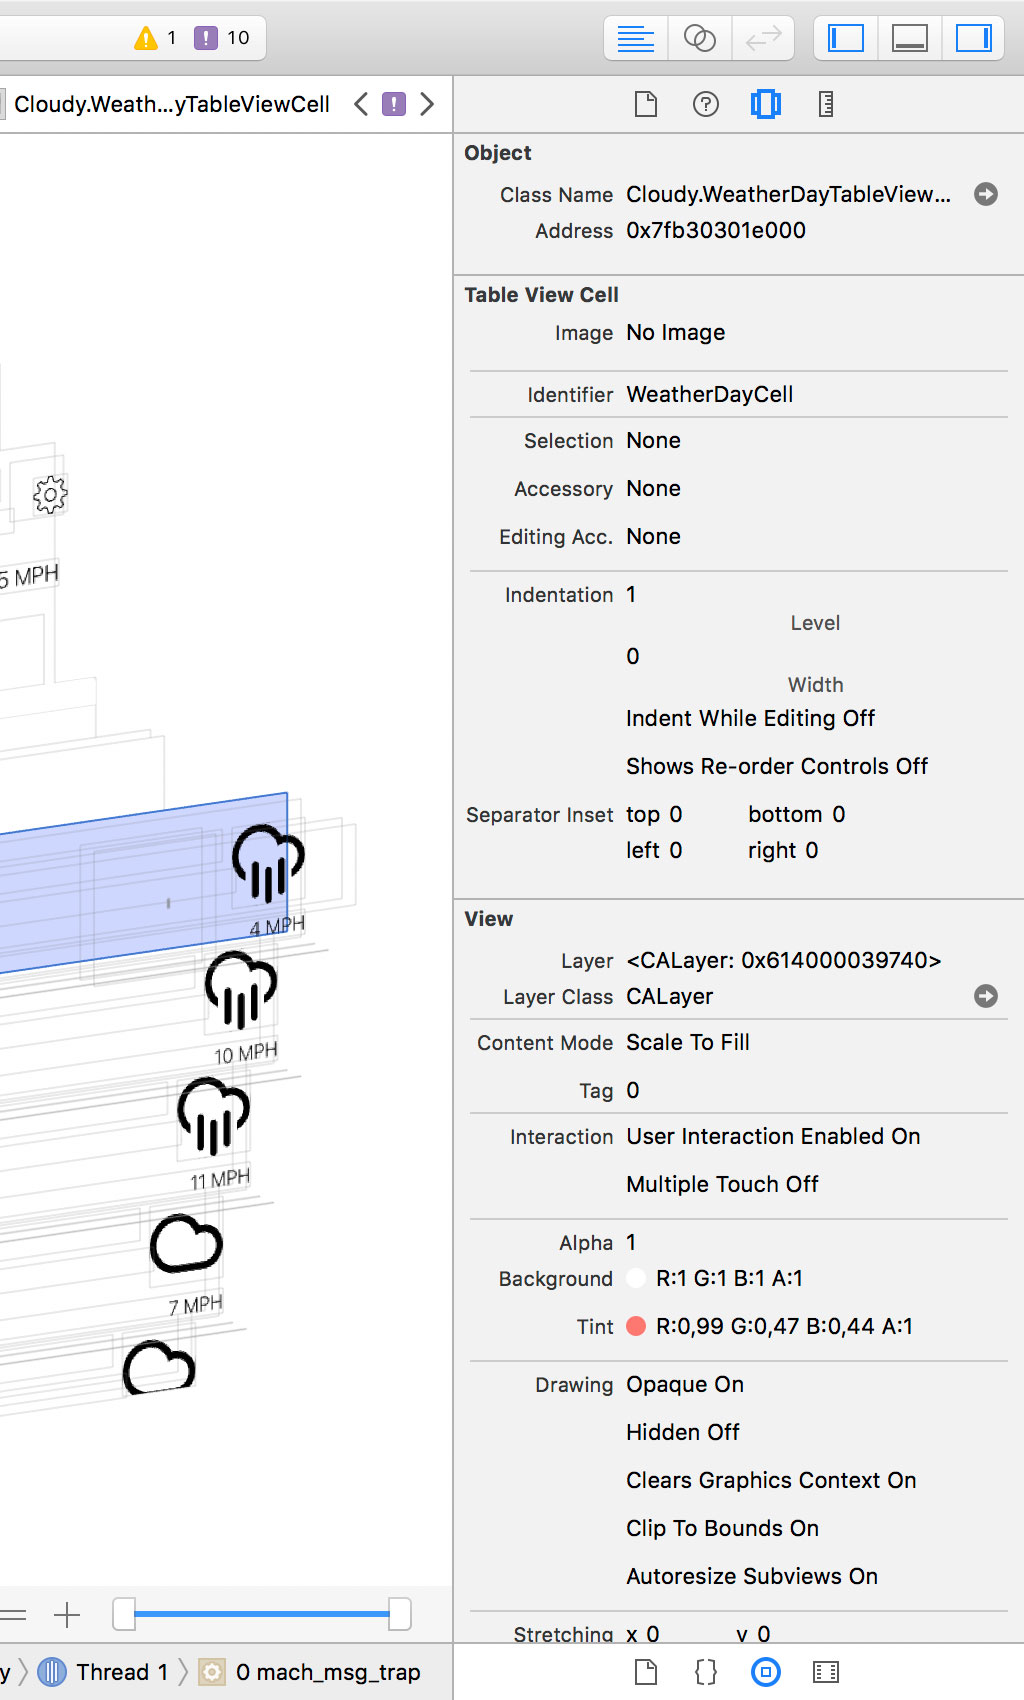
The information displayed in the Object Inspector is very convenient to get a quick overview of the attributes of an element, which is useful to debug common user interface issues.
The Object Inspector is also convenient for debugging view controller containment. If you select a view controller, it shows you the parent view controller and its child view controllers.
Size Inspector
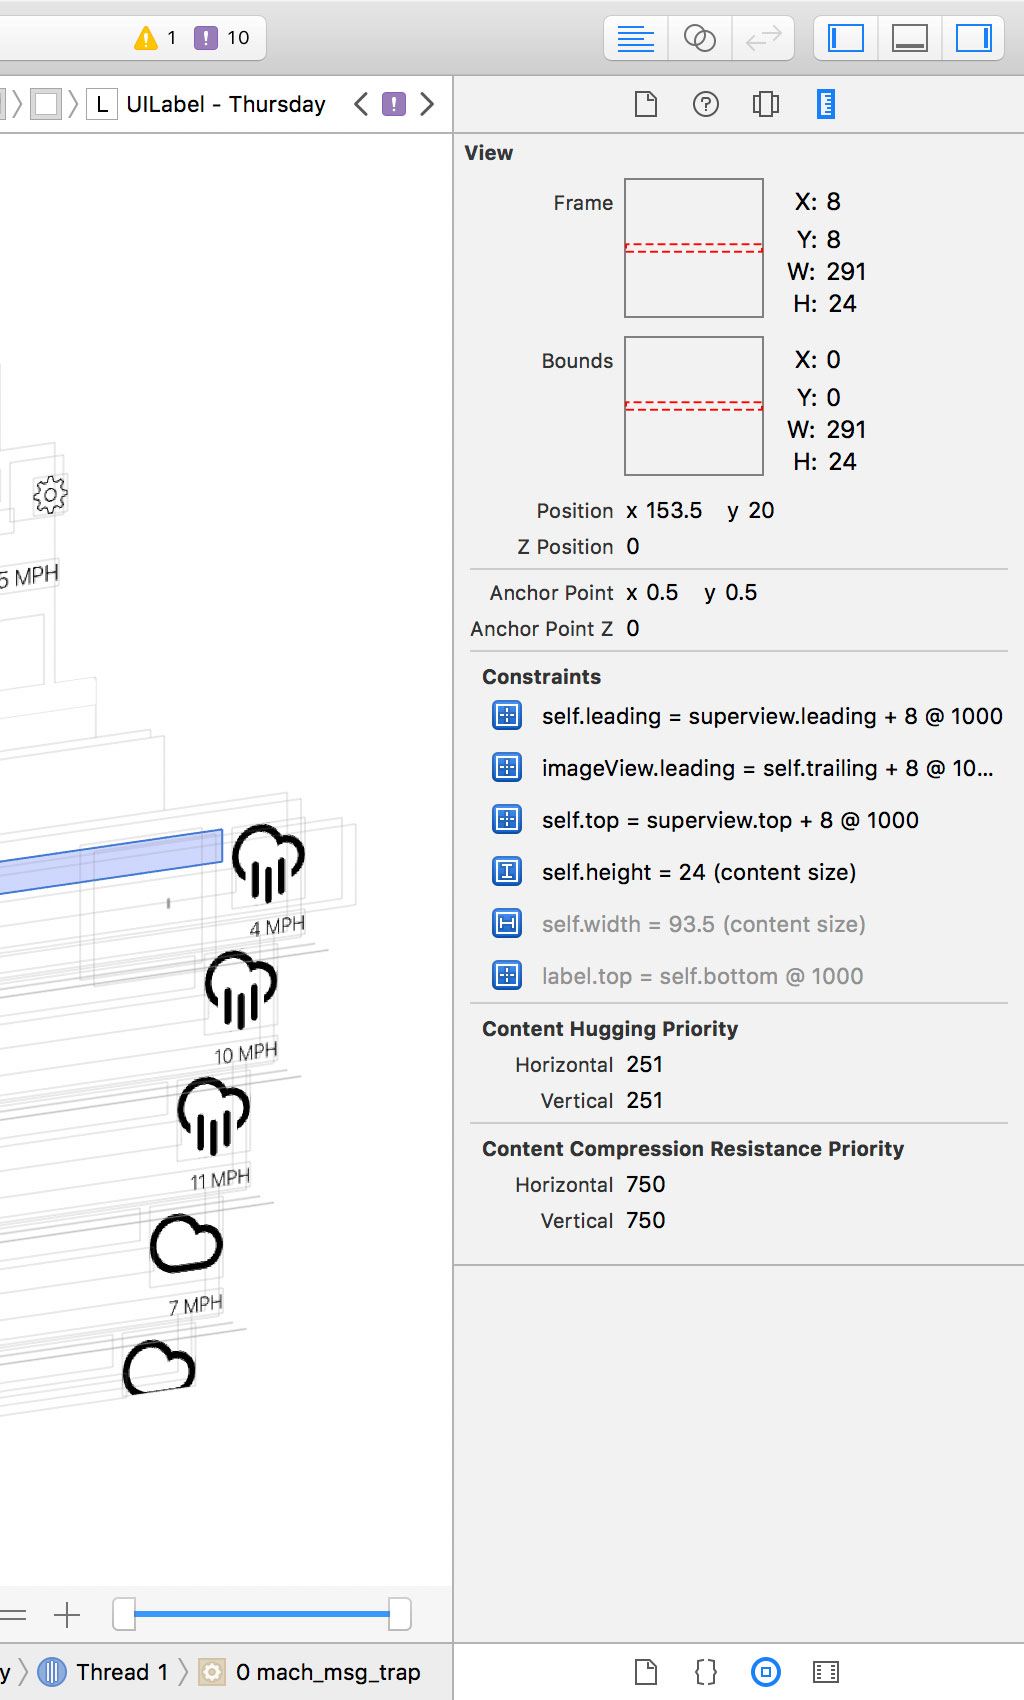
The Size Inspector summarizes the layout attributes of the selected view, such as frame, bounds, and constraints. The list of constraints is particularly useful for debugging issues related to Auto Layout.
Assistant Editor
The most important downside of the view debugger is its reliability. Xcode sometimes fails to create a snapshot of the view hierarchy or the view debugger shows you incorrect information. The Assistant Editor also suffers from this problem.
The Assistant Editor should have the ability to show you the implementation of custom classes when selected in the main window or the Debug Navigator. While this is very convenient, it isn't working for me in the current release of Xcode.
What's Next?
I hope this episode has shown you the potential of the view debugger. It's a powerful tool to debug user interface issues.
The view debugger works very well with UIKit components and, as of Xcode 9, it also supports SpriteKit and SceneKit. We won't cover this aspect of the view debugger in this series.
Earlier in this episode, I mentioned that I sabotaged Cloudy by introducing a few user interface issues. In the next episode, we use the view debugger to find these issues and resolve them.